
MCP Workbench
Understand the code. Review the work. Measure what changed.
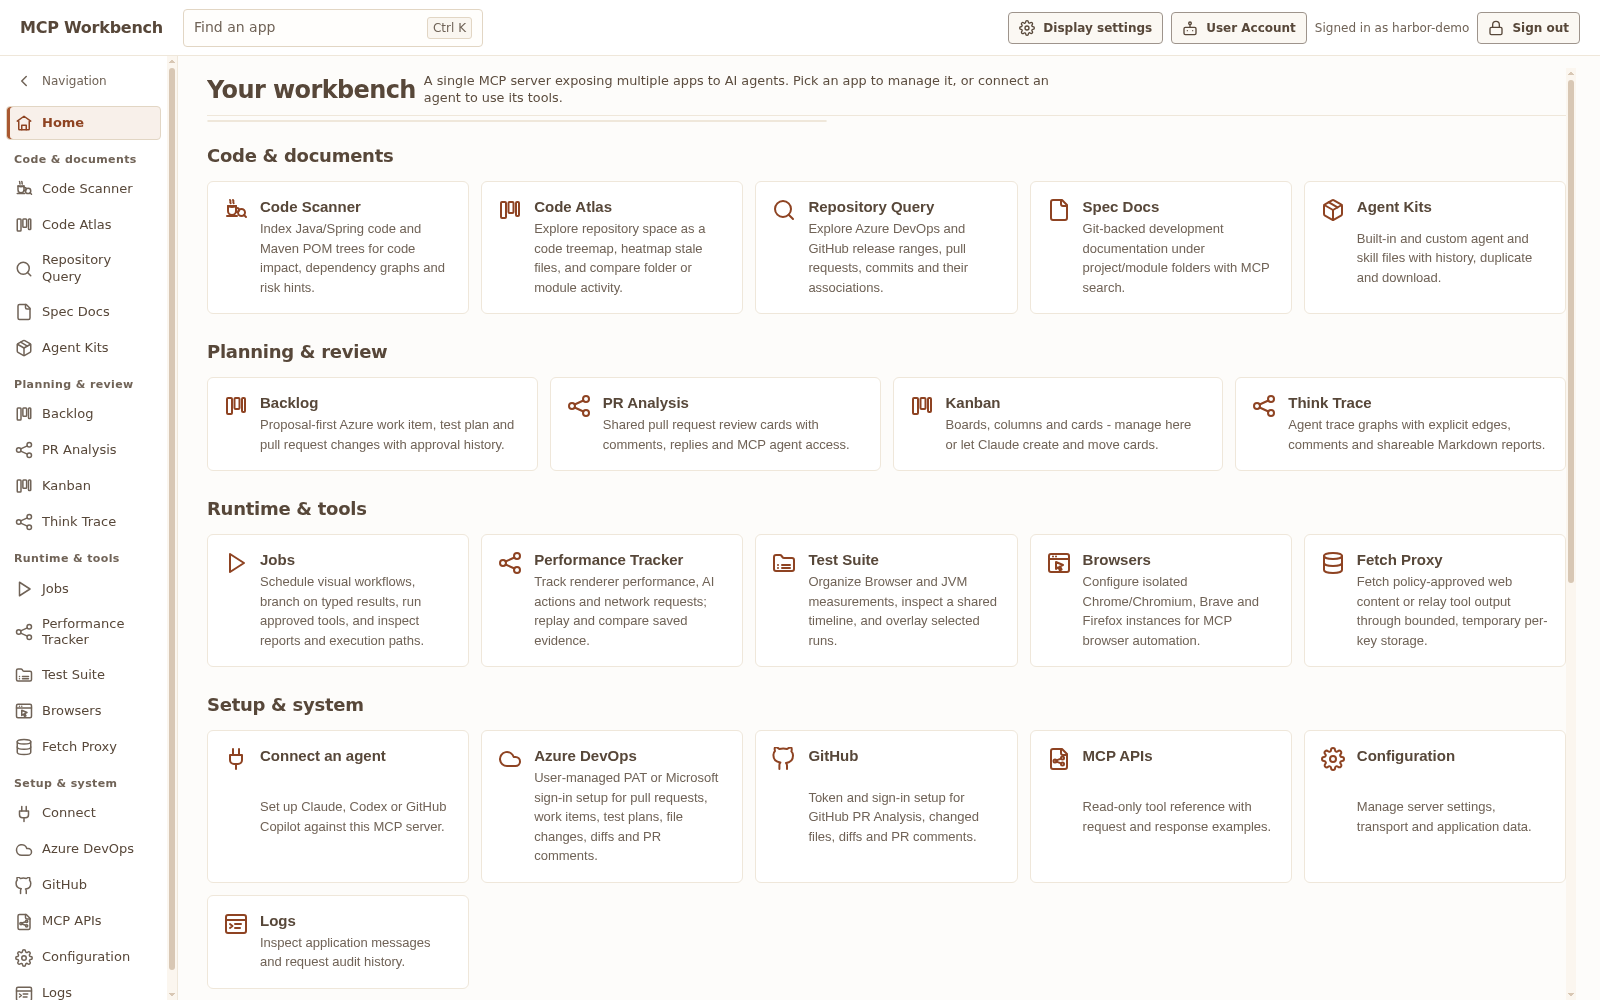
MCP Workbench brings people and MCP agents into one technical workspace: explore code and release history, plan and review changes, share isolated browsers, automate jobs, and record browser and JVM performance. Reusable Test Suite profiles keep repeated measurements and their evidence together.
Run it locally with the default H2 file or self-host it with PostgreSQL when you need something sturdier. You control the credentials, MCP keys, browser profiles, network policy, data storage, and which external writes are approved.
This tour reflects the current development interface. Check the release notes for the capabilities included in your download.
Windows and macOS builds are unsigned and may trigger OS or browser download warnings.
Problem, meet toolbox
A connected workspace from first question to saved evidence.
Use the portal directly or connect an MCP client. Scoped tools, reviewable local records and links into the same workspace let people and agents work with the same context.
All Workbench screenshots use the current application interface with populated, fictional Harbor and Acme examples. Names, code, conversations, credentials and measurements are demonstration data, not customer information or benchmark results. Illustrated AI conversations are examples, not recorded provider responses.
MCP keys and tool access
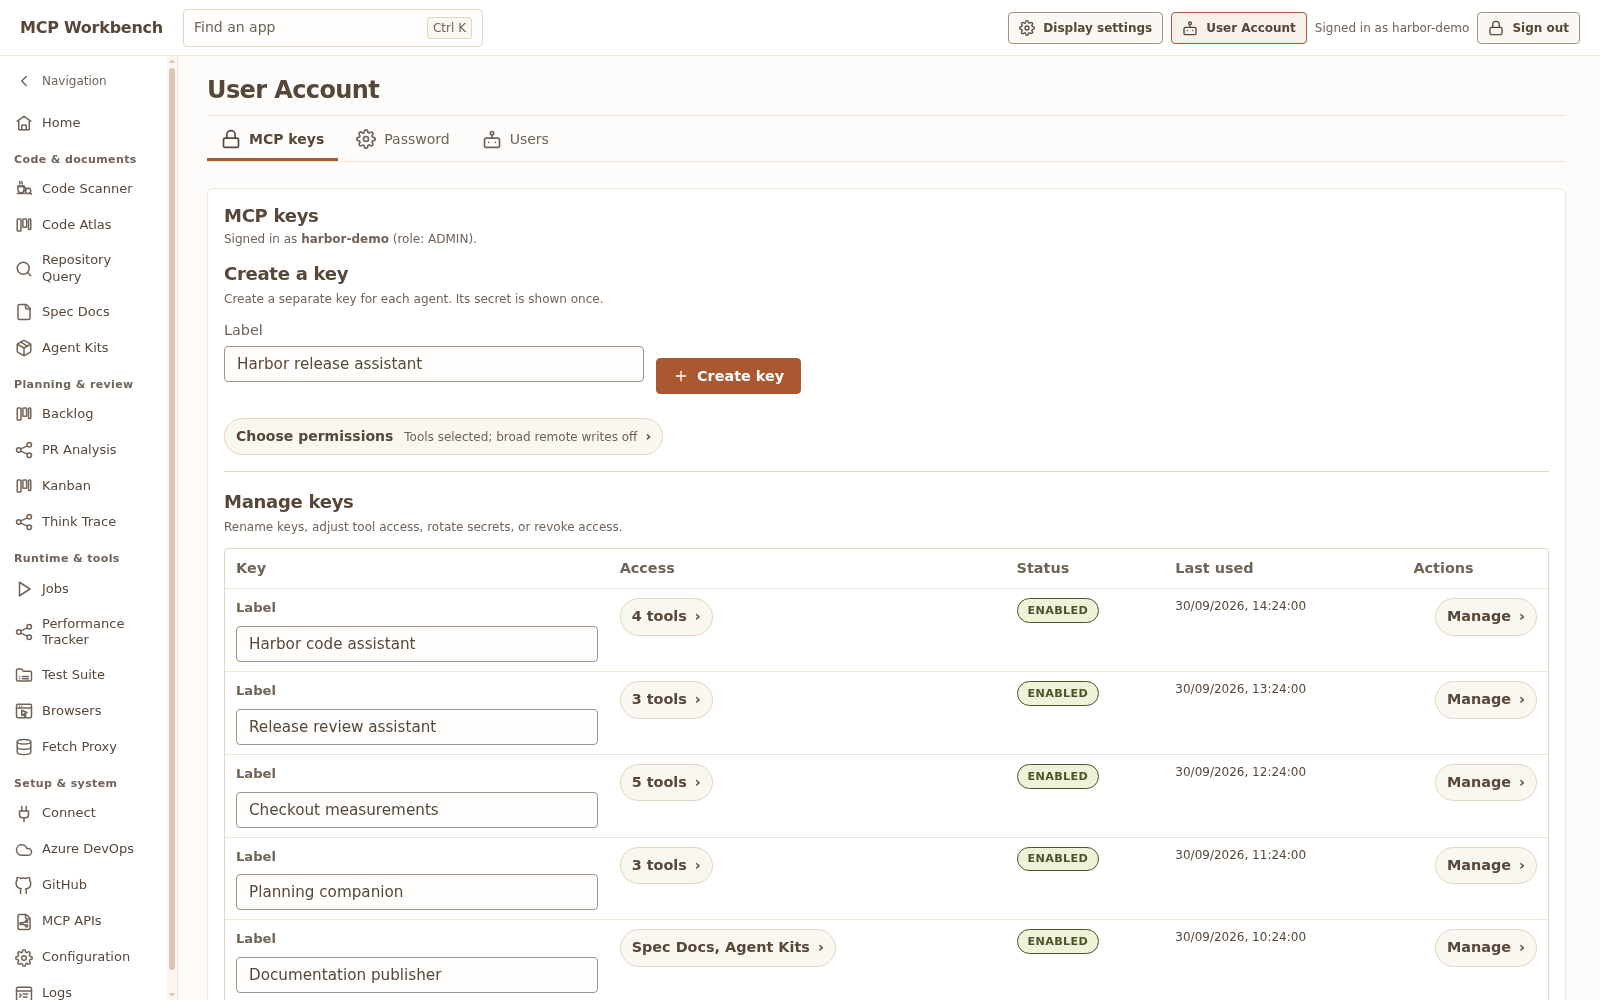
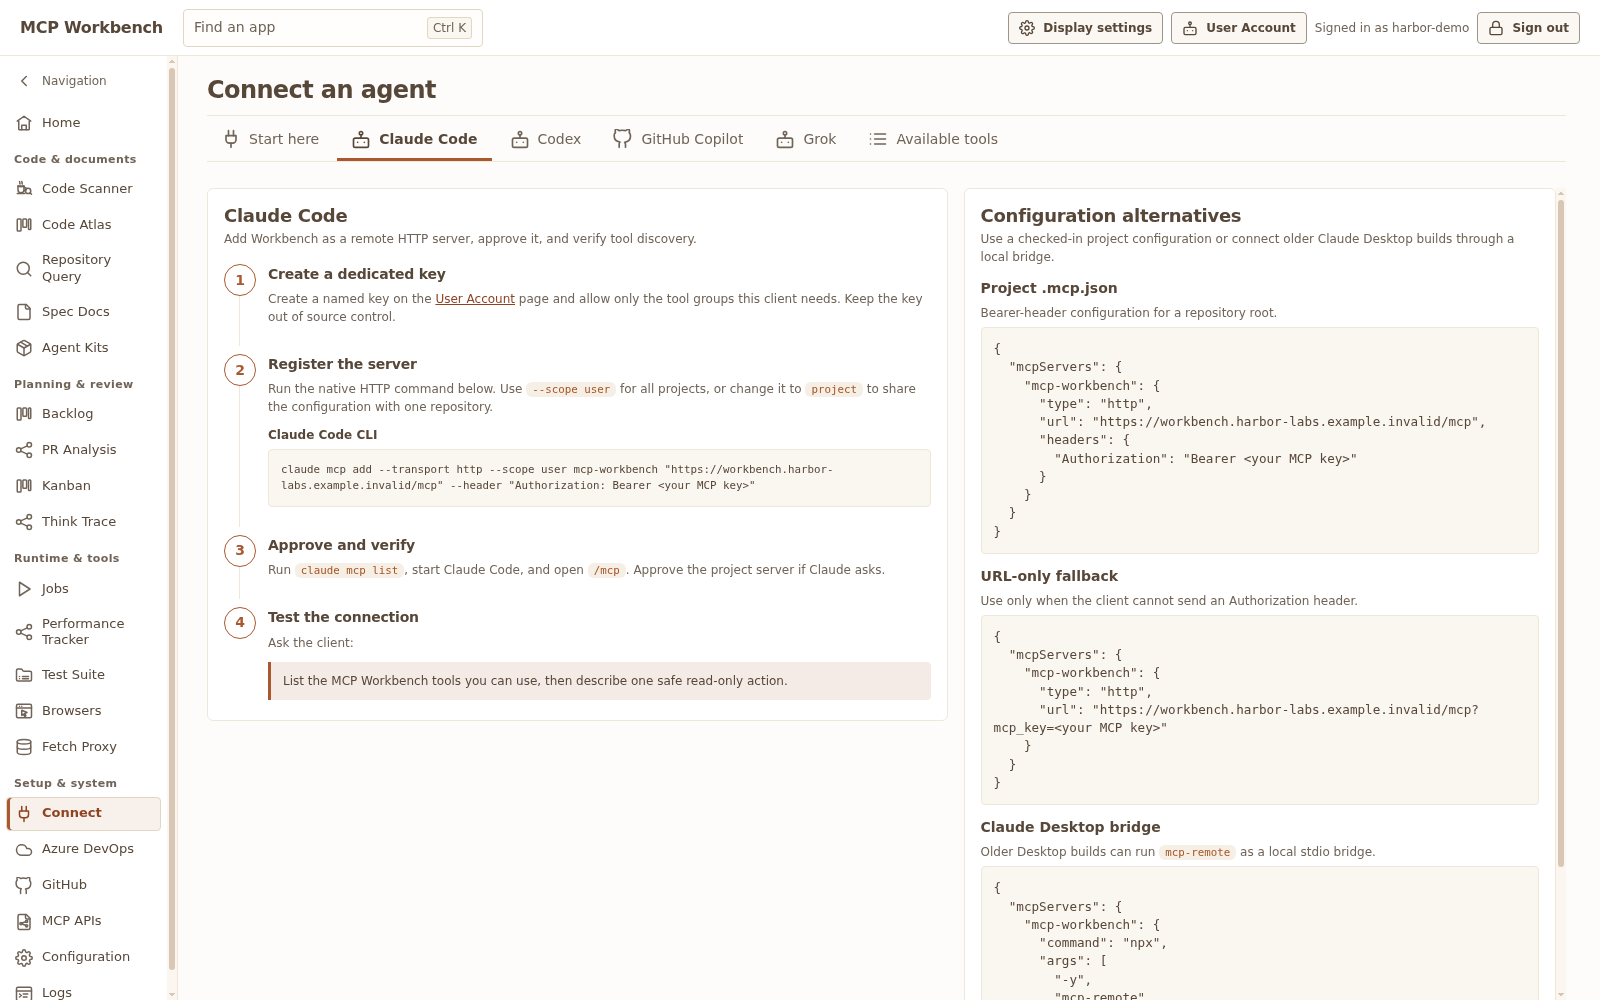
Create per-user MCP keys, choose their tool groups, and follow client-specific setup for Claude Code, Codex, GitHub Copilot, Grok or another MCP client. Performance, JVM, Test Suite and configuration grants remain explicit; owning a key does not grant every capability.
Fetch Proxy
Your AI harness cannot reach an allowed page, blocks curl, or chokes on a large response. Fetch it through Workbench, search the temporary result, and read only the bounded parts you need.
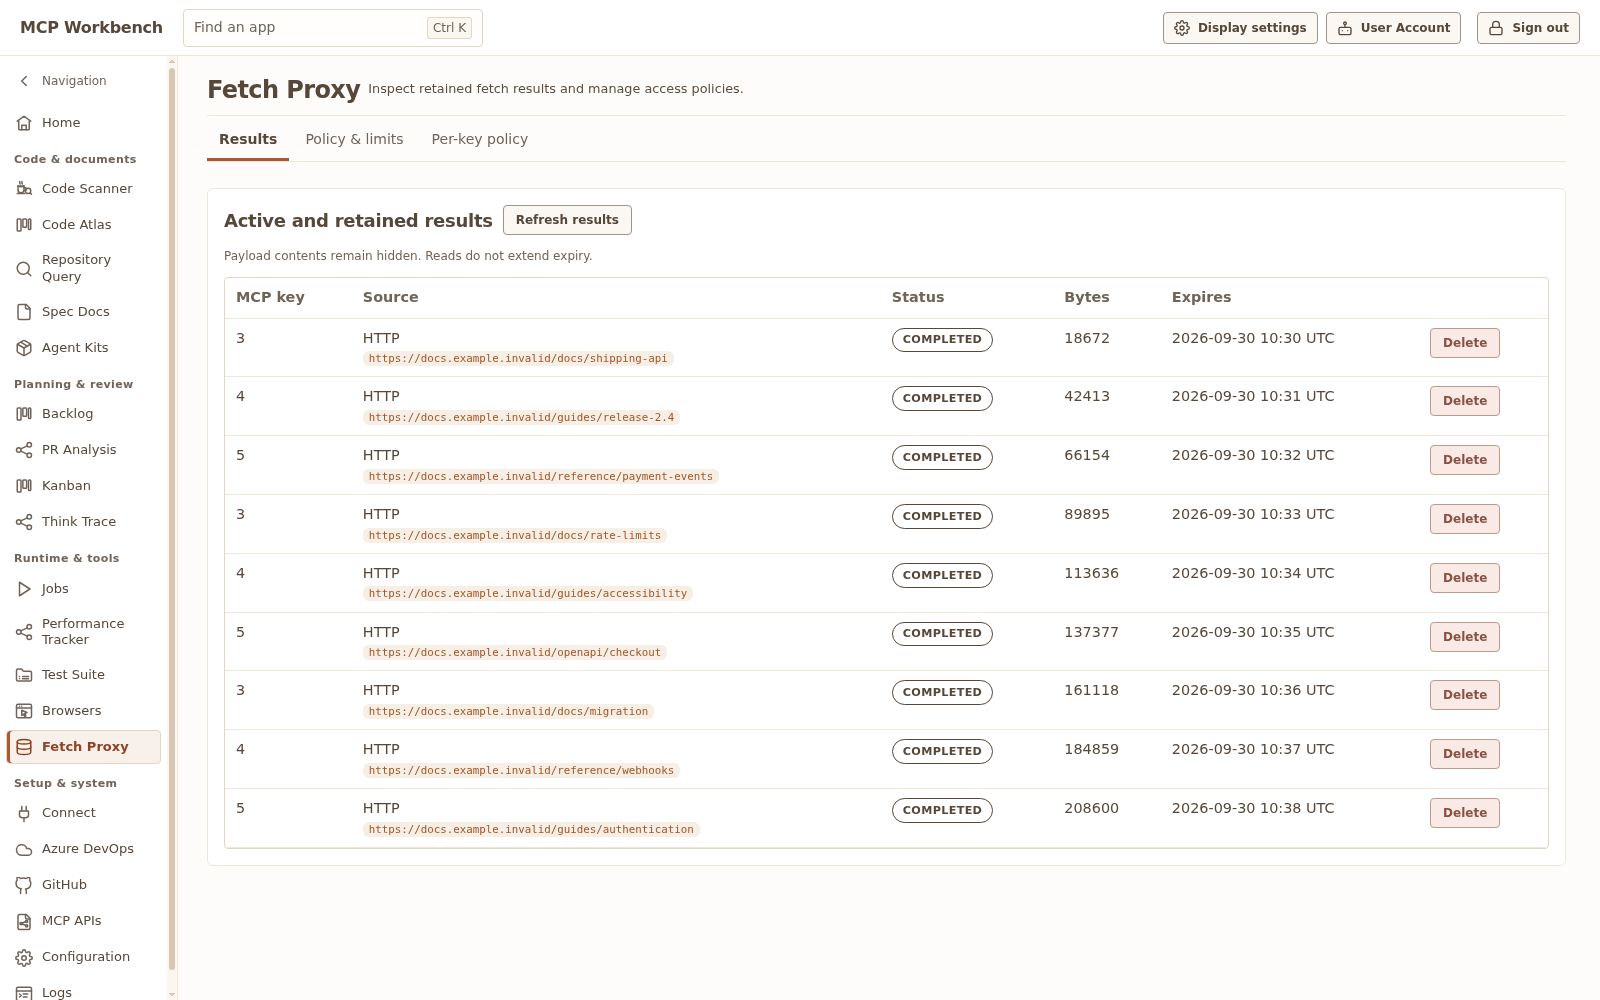
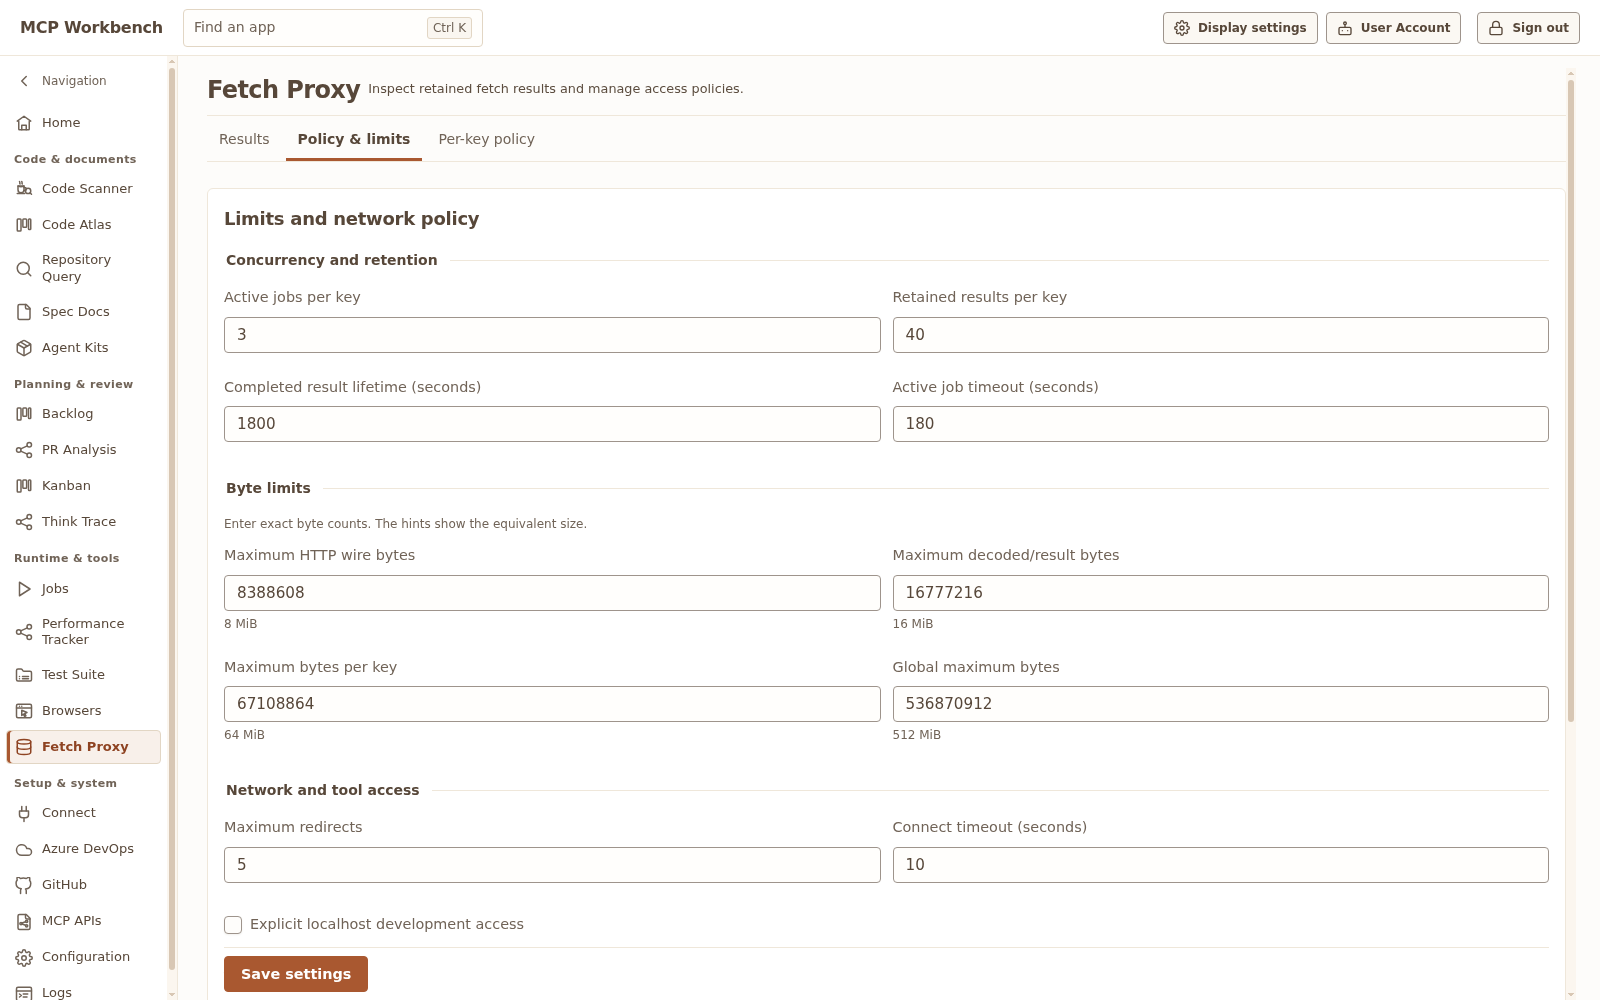
Small fetch or huge reference page: the same policy boundary, a different reading strategy.
Cooperative browsers
The AI can open an isolated Chrome, Chromium, Brave or Firefox session while you watch, take over and leave selector-linked notes. Saved definitions cover local and authenticated helper execution; snapshots, tabs, screenshots and console output support the handoff.
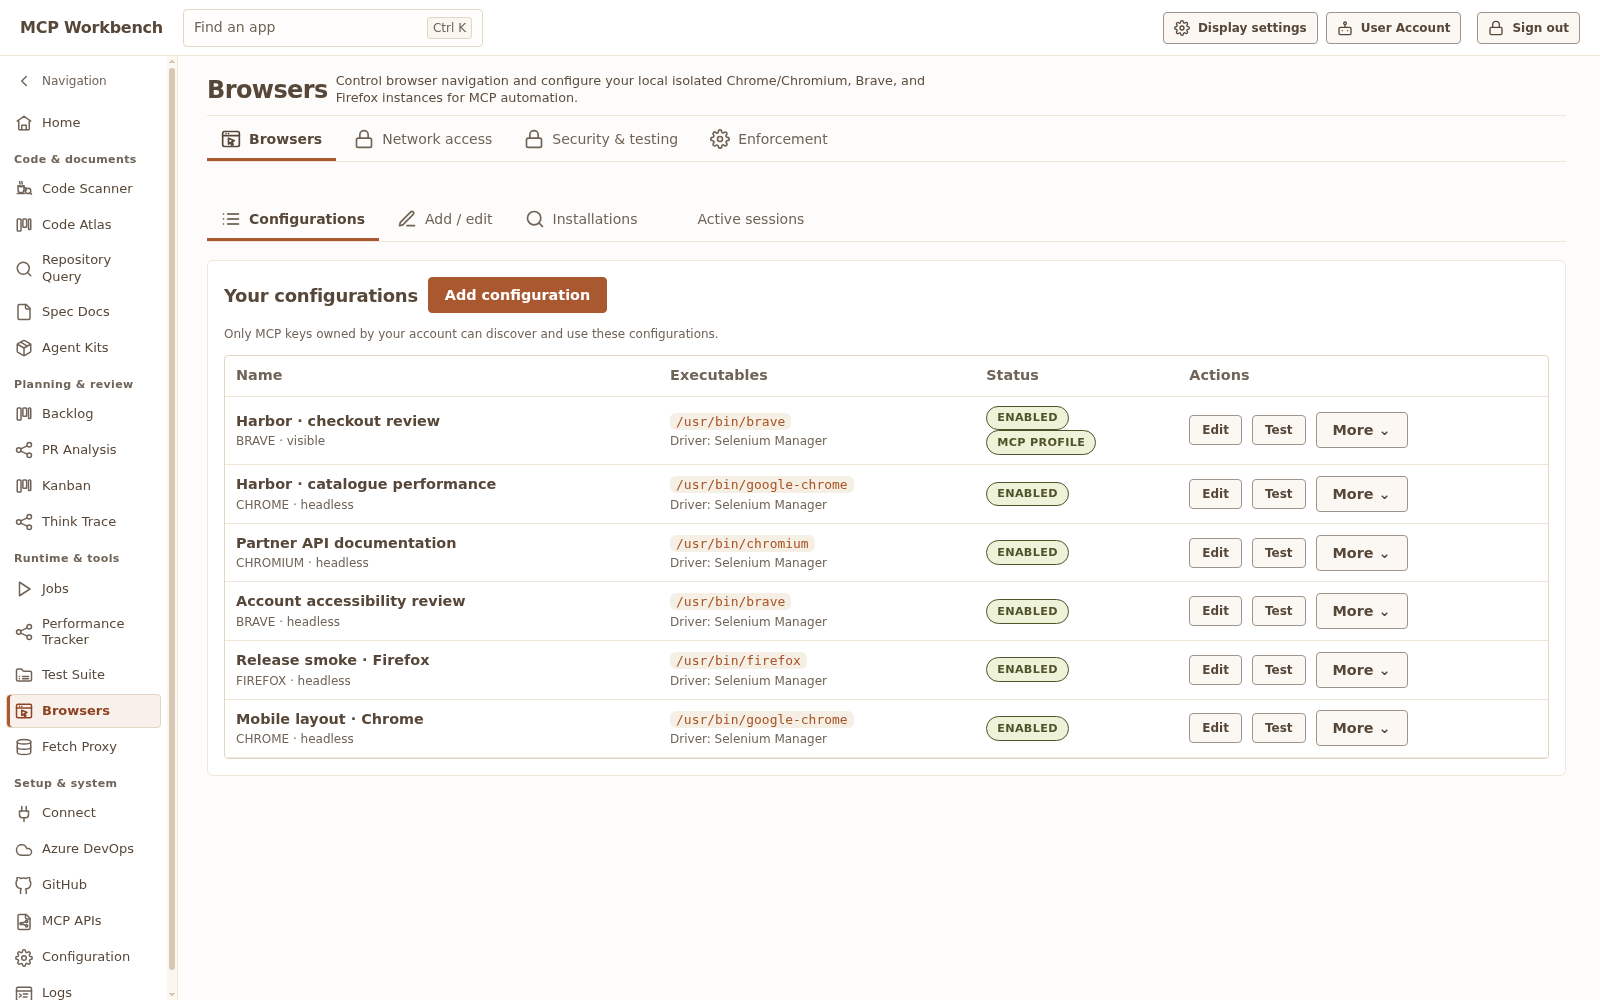
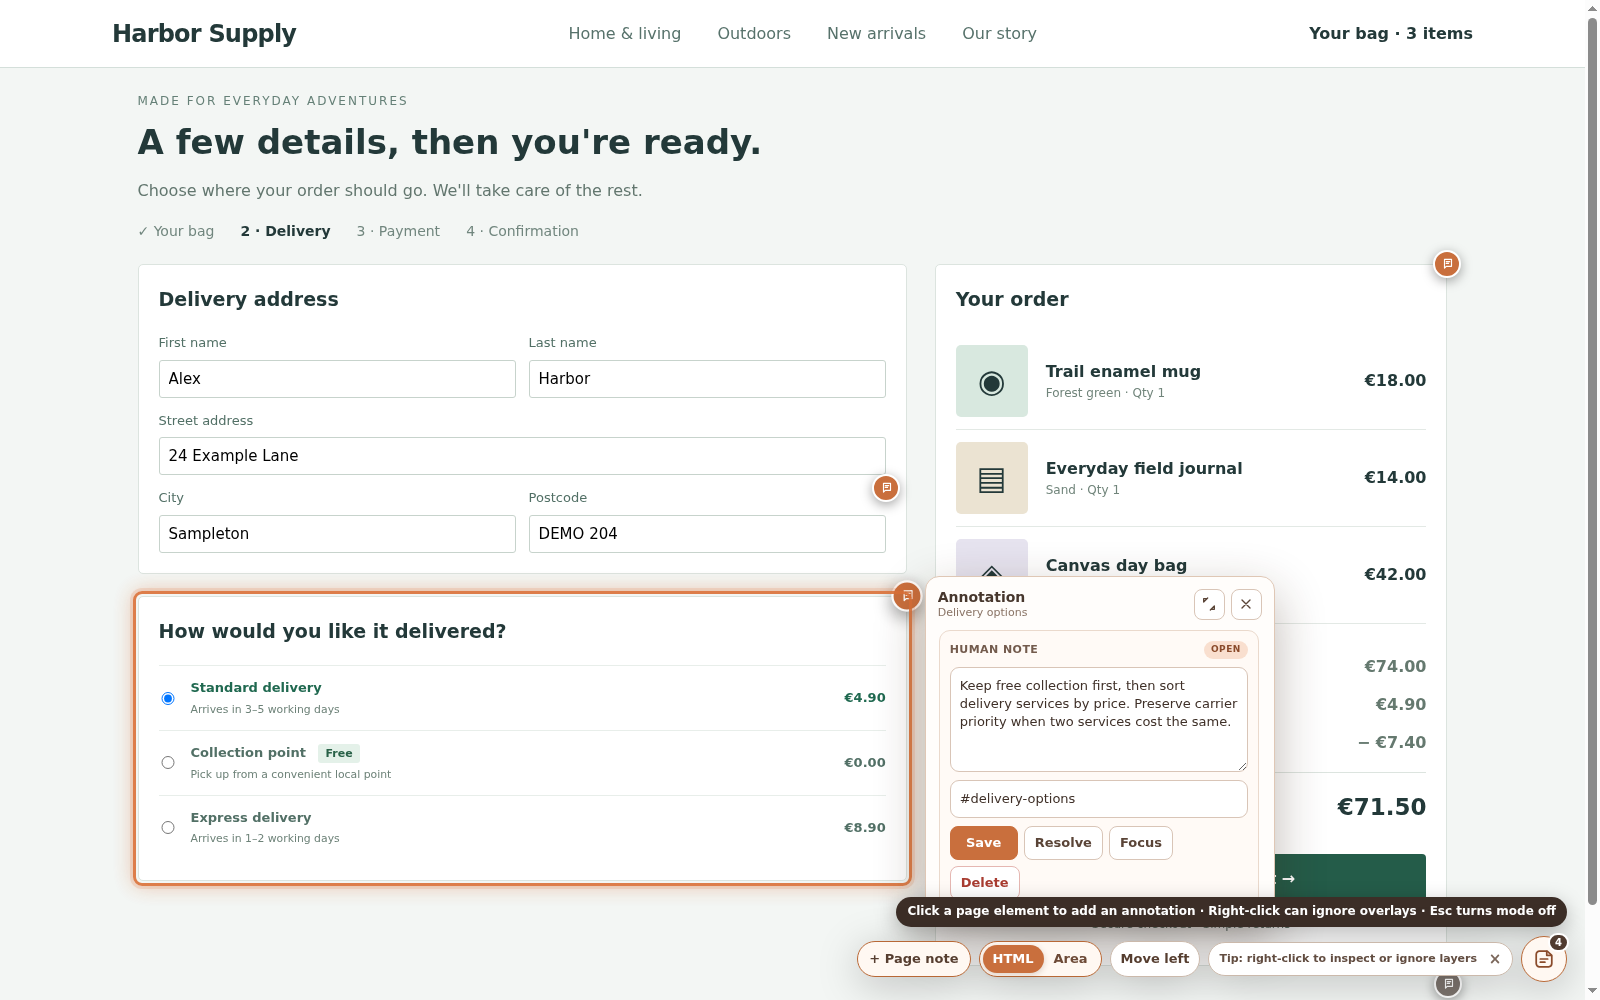
Browser QA adds scoped network inspection, request replay, cookie controls and connection observations where the browser supports them. Sensitive capture and changes require their own permissions and destination policy.
GitHub and Azure DevOps
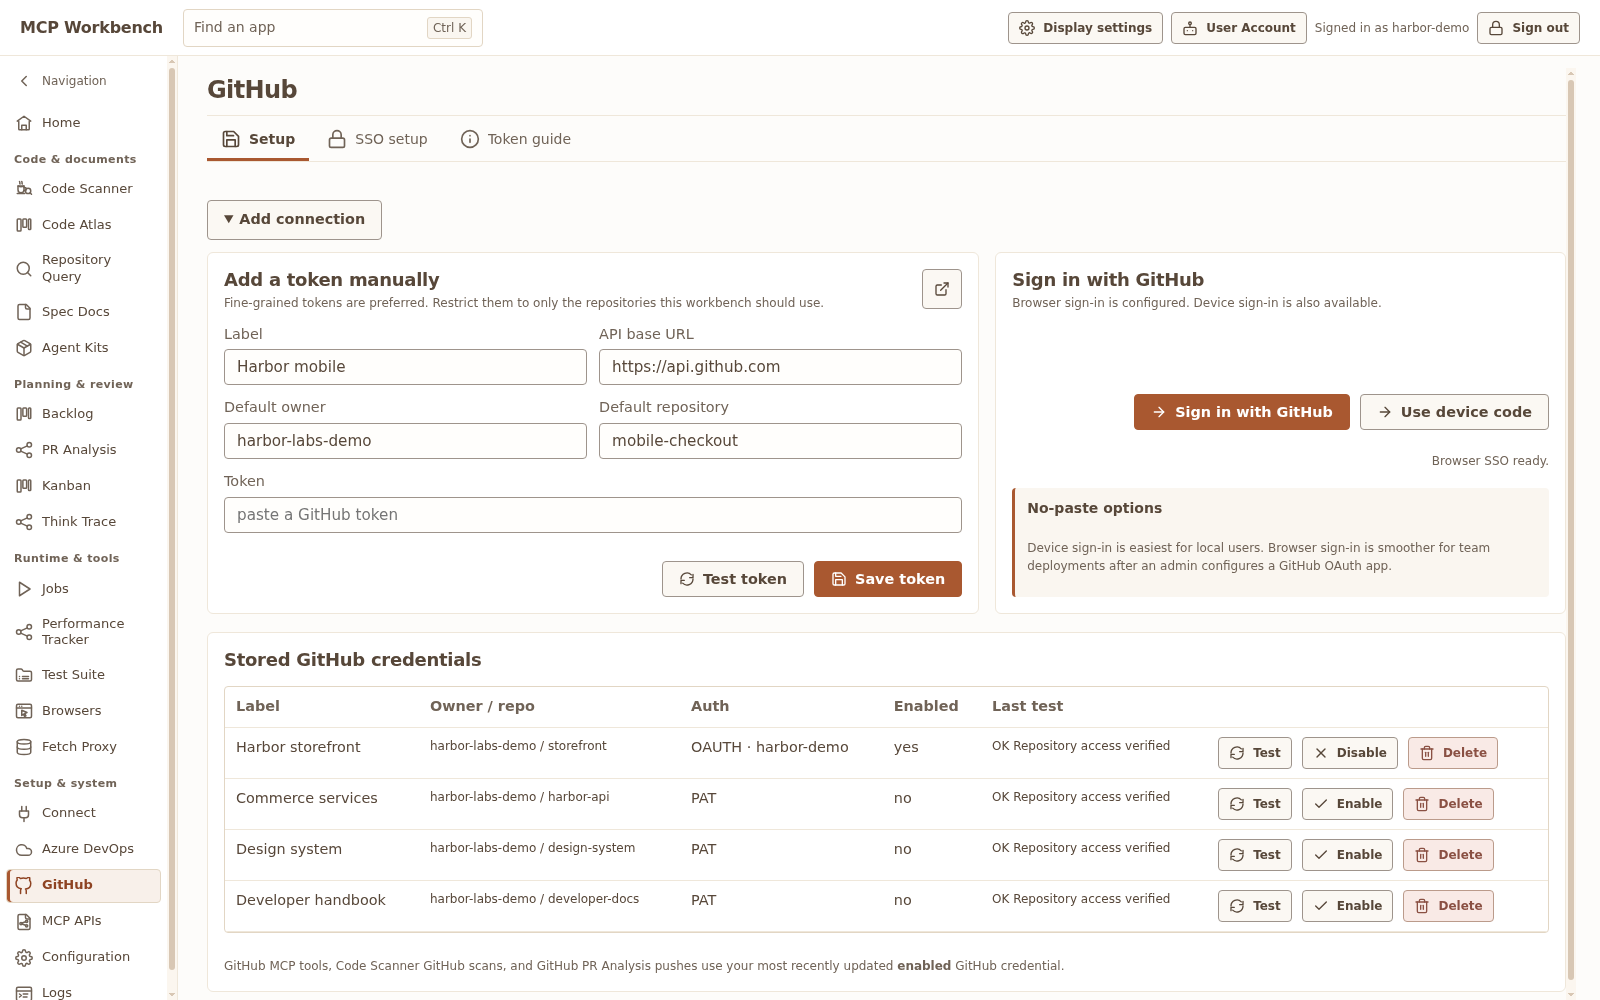
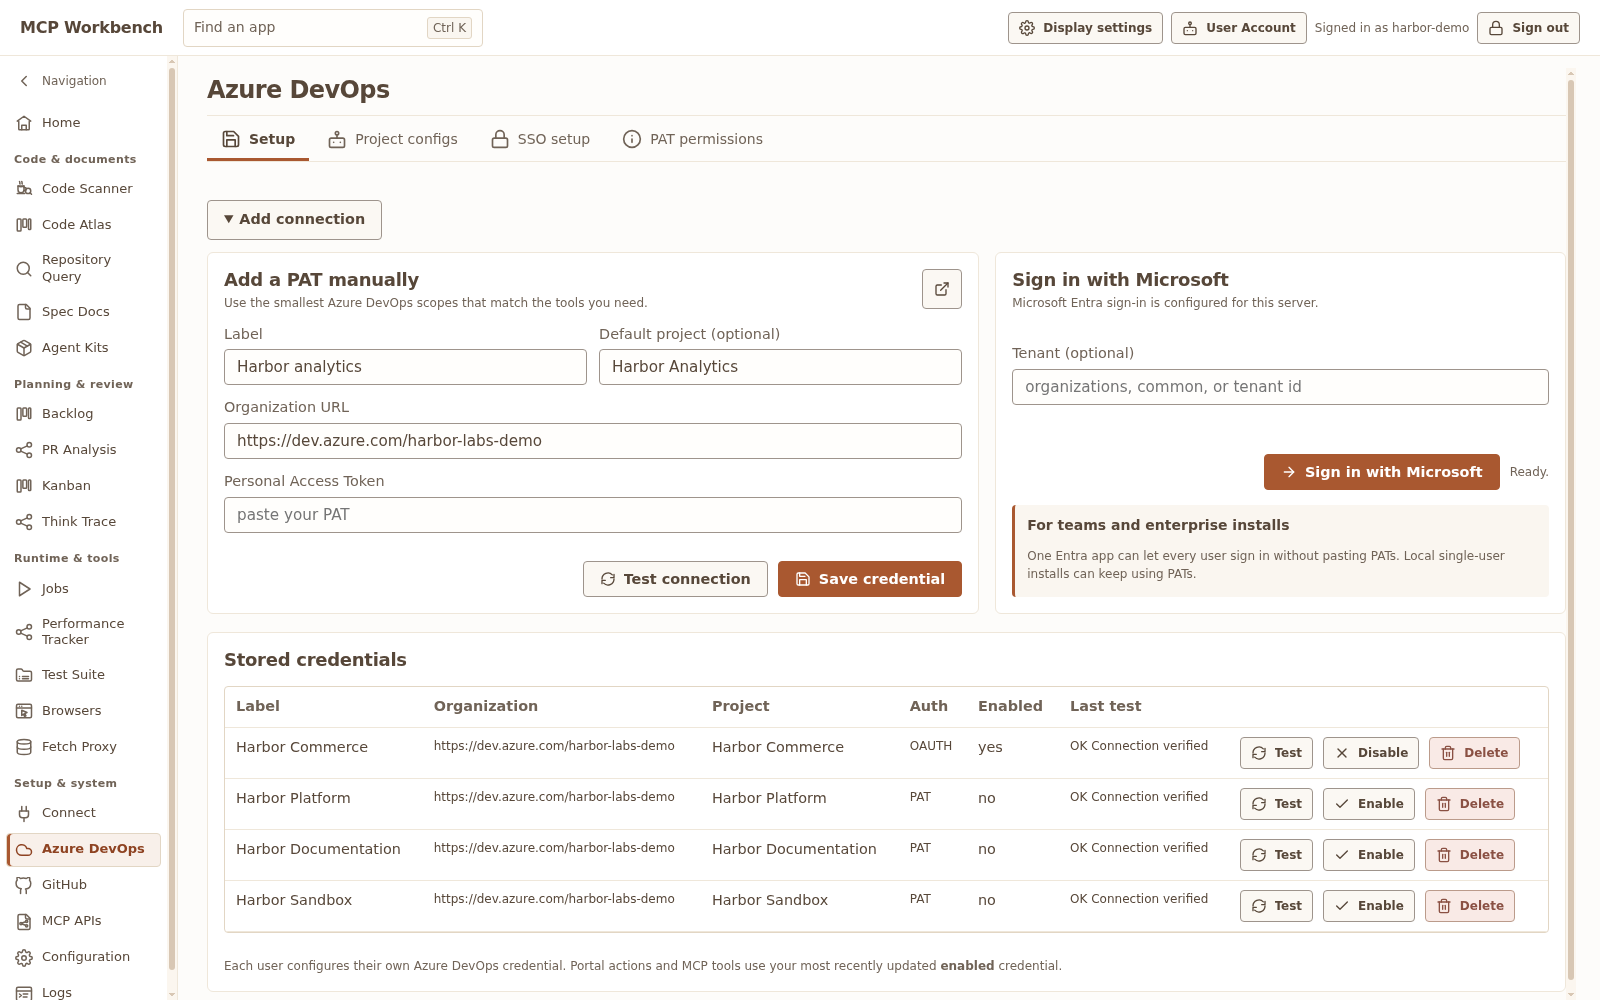
Store user-managed credentials for pull requests, diffs, files, branches, issues, work items, test plans and PR comments. Azure project configurations describe expected custom fields and can narrow assigned keys to approved work-item subtrees or PR target branches.
Kanban and backlog proposals
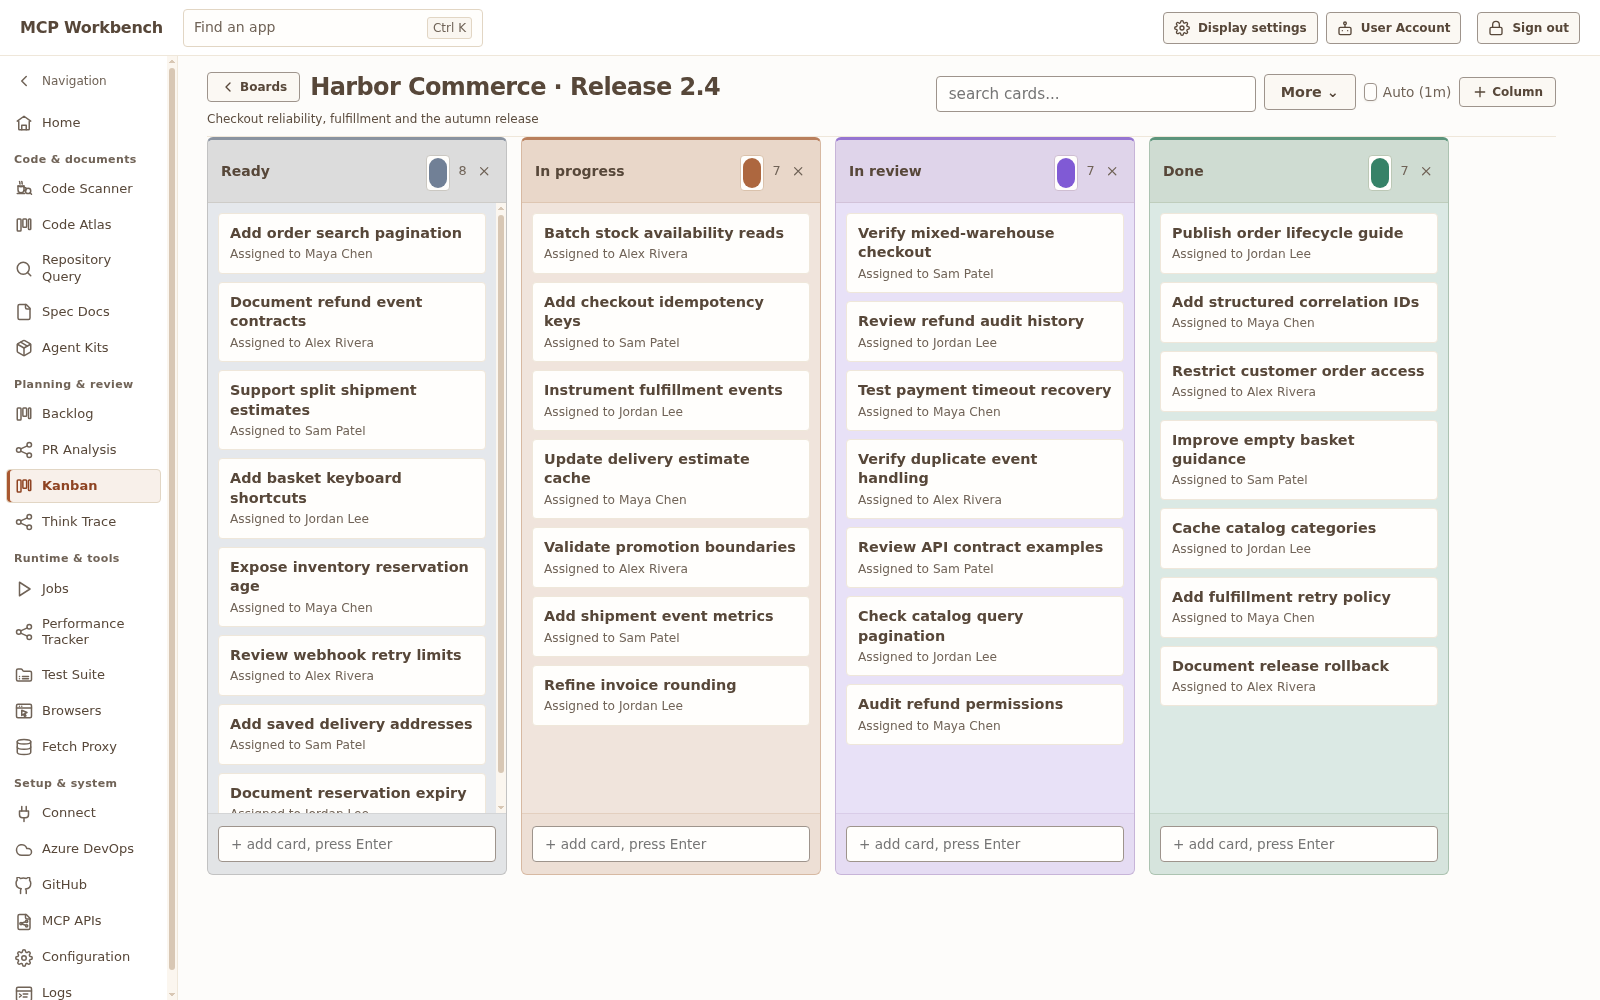
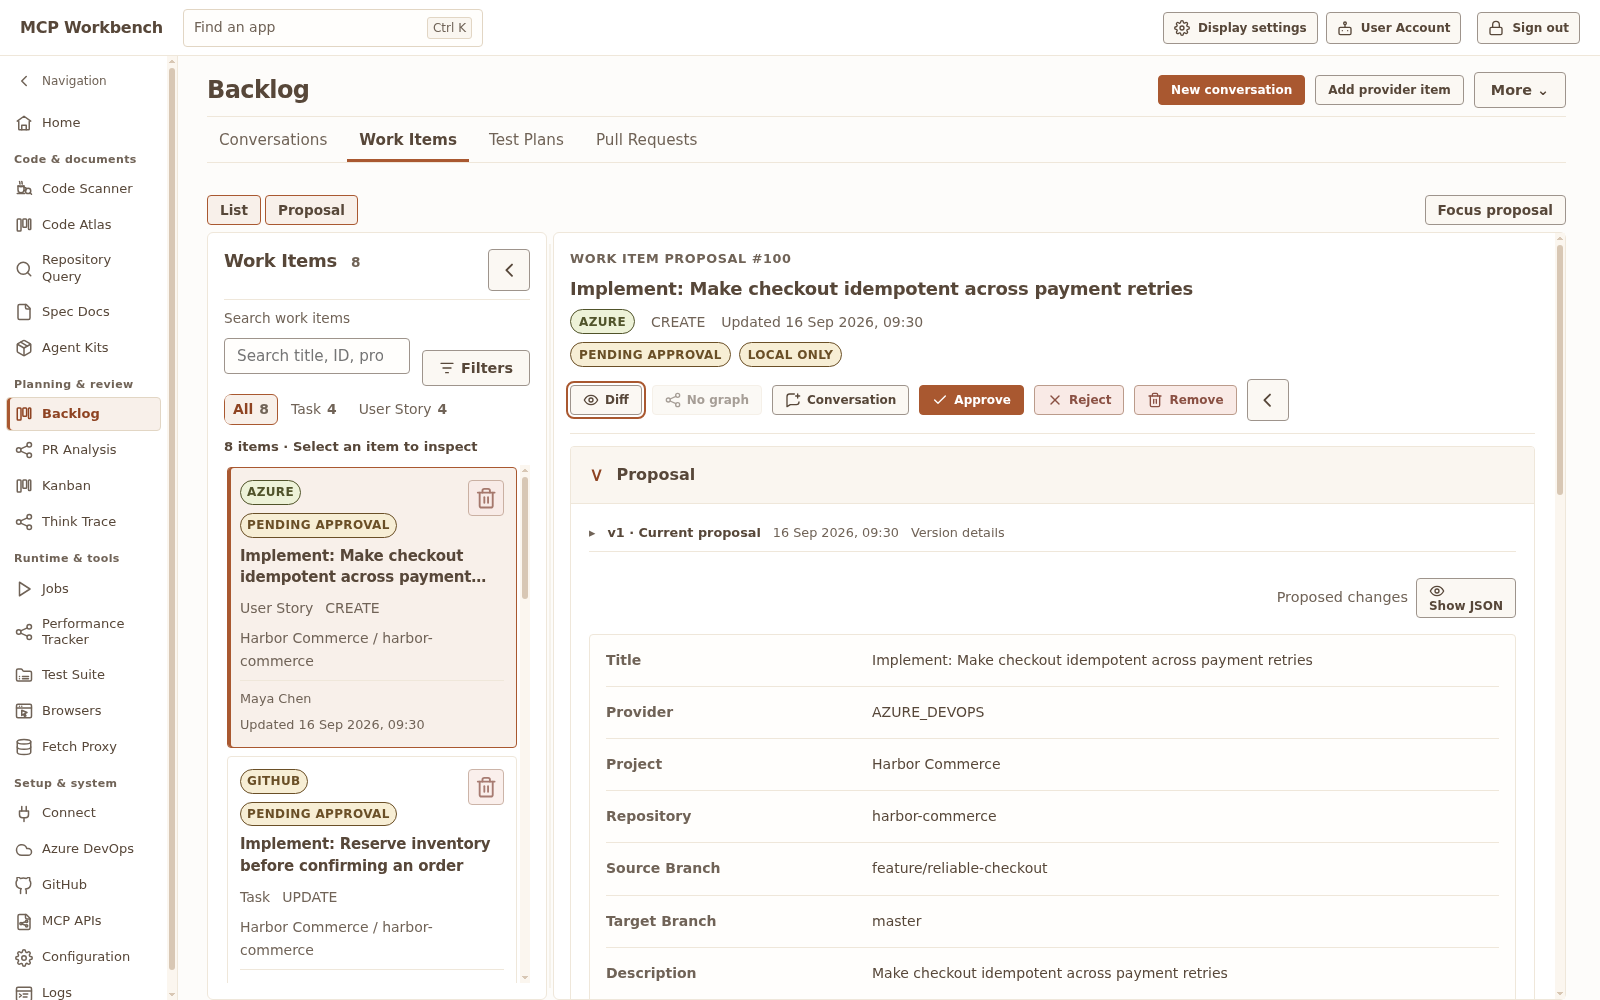
Organize local boards with cards, comments and links, then turn conversations into versioned work-item, issue, test-plan or pull-request proposals. Review text or JSON, inspect historical versions and approve scoped publication; explicitly granted immediate-write permissions remain separate.
PR Analysis workspace
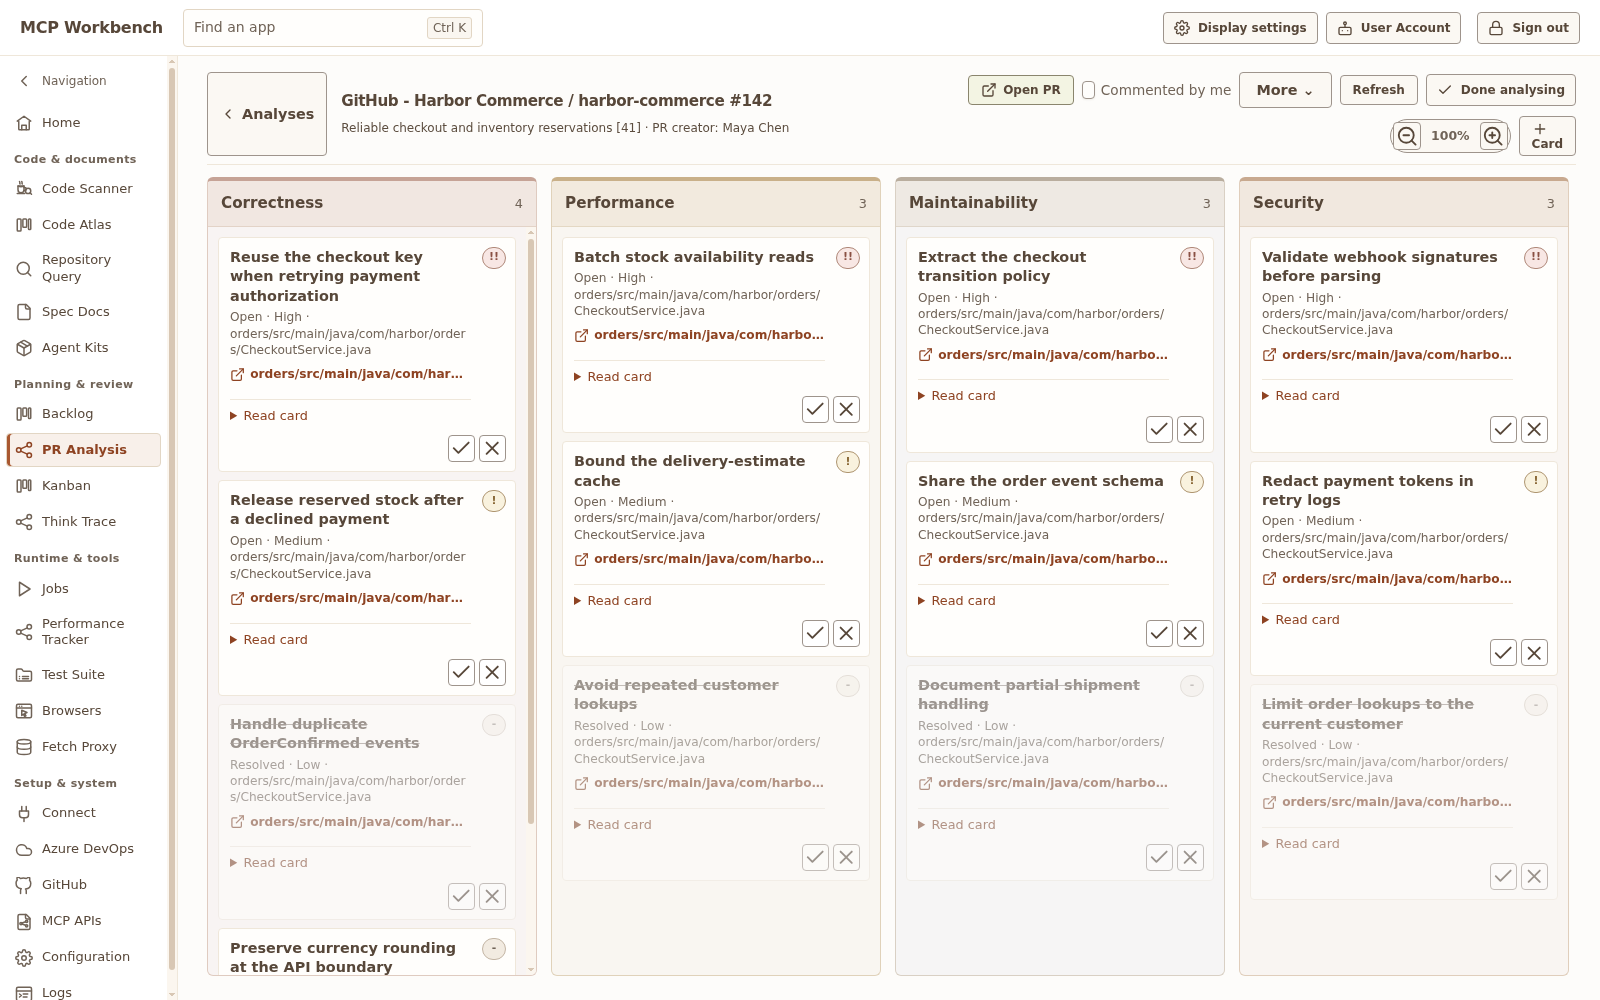
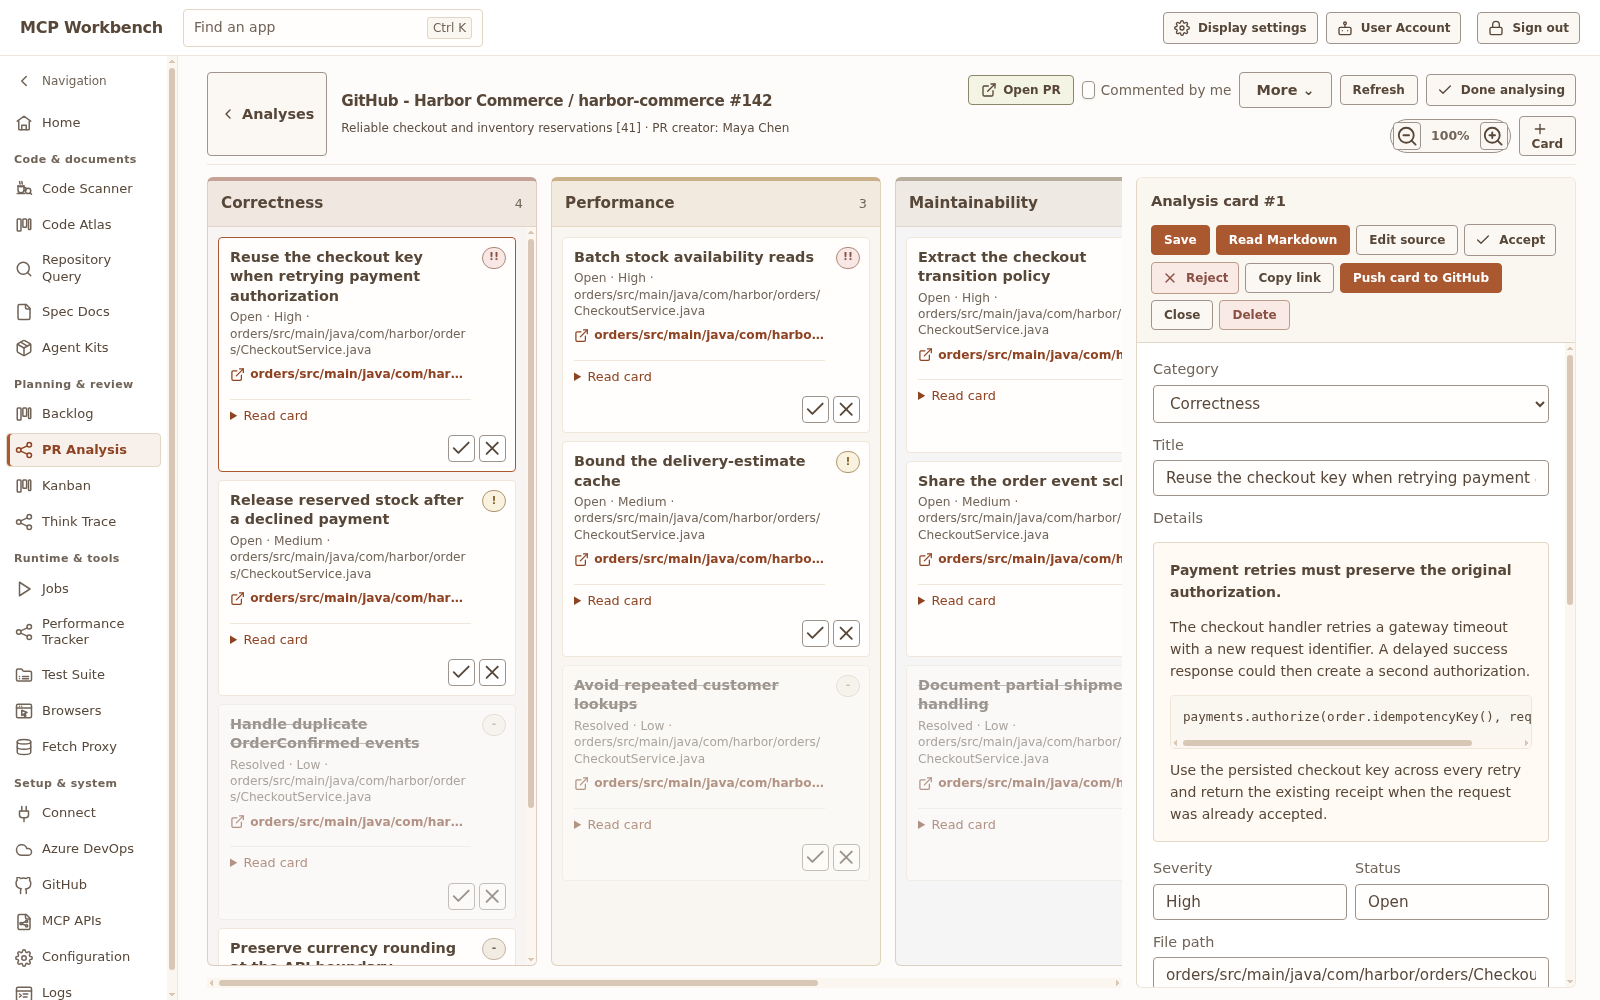
Review Azure DevOps or GitHub pull requests in shared local analyses. Organize findings, comments, replies and history, follow live updates, export review material and publish selected feedback through the configured write permissions.
Agent Kits and Spec Docs
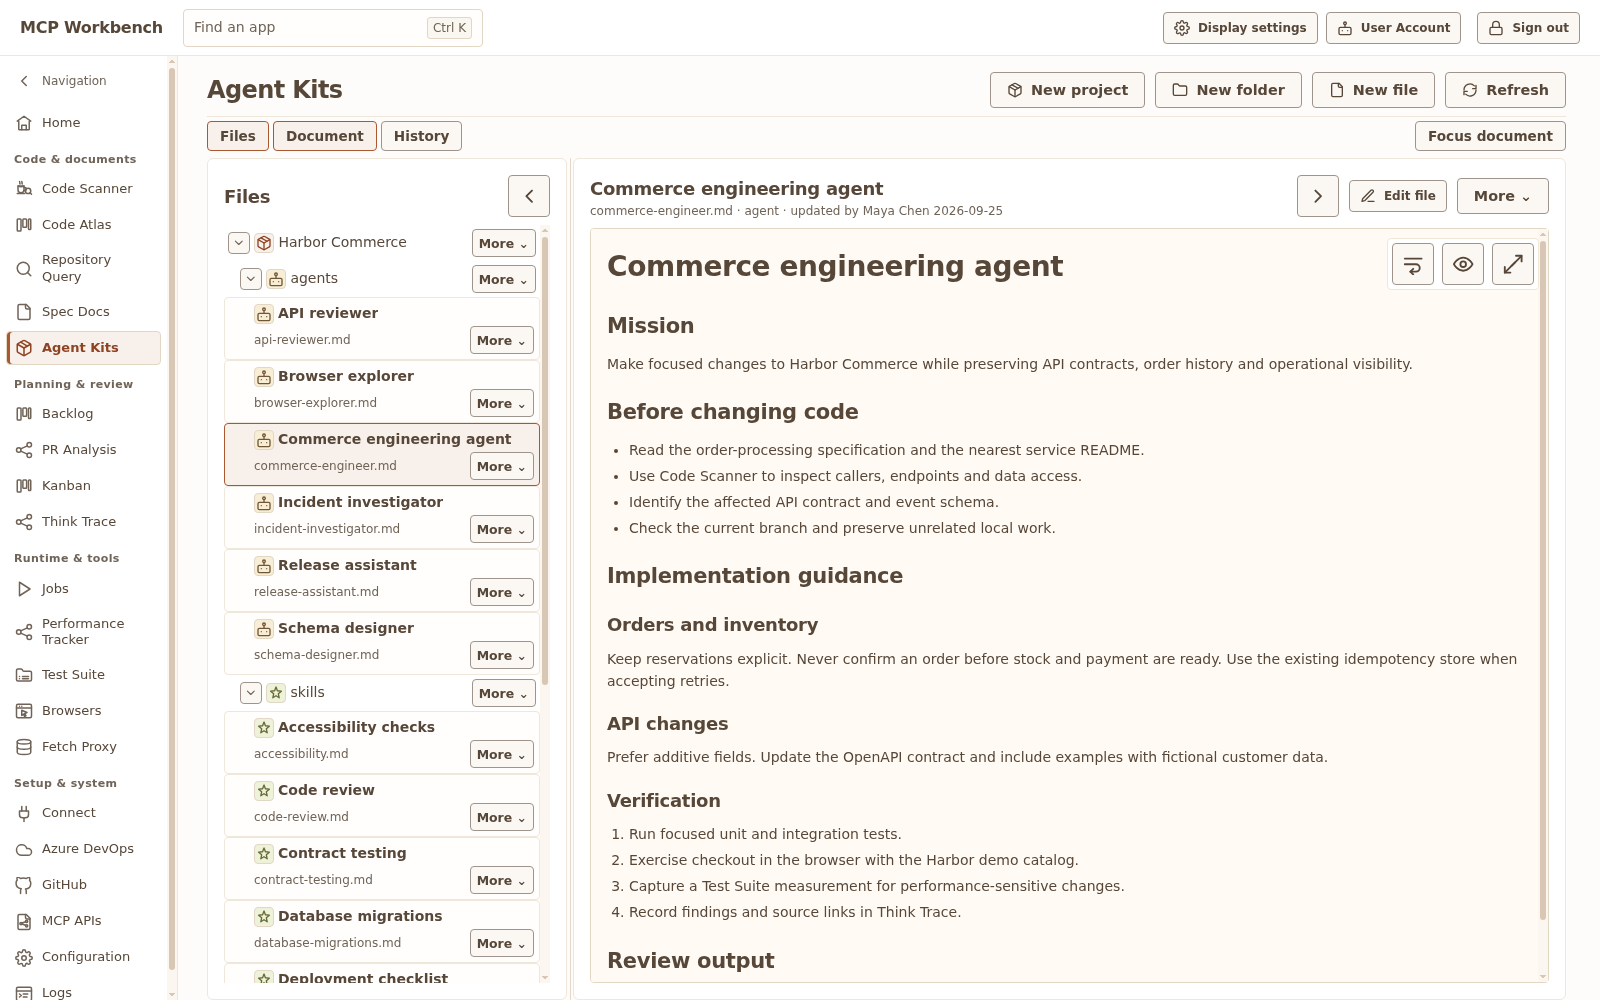
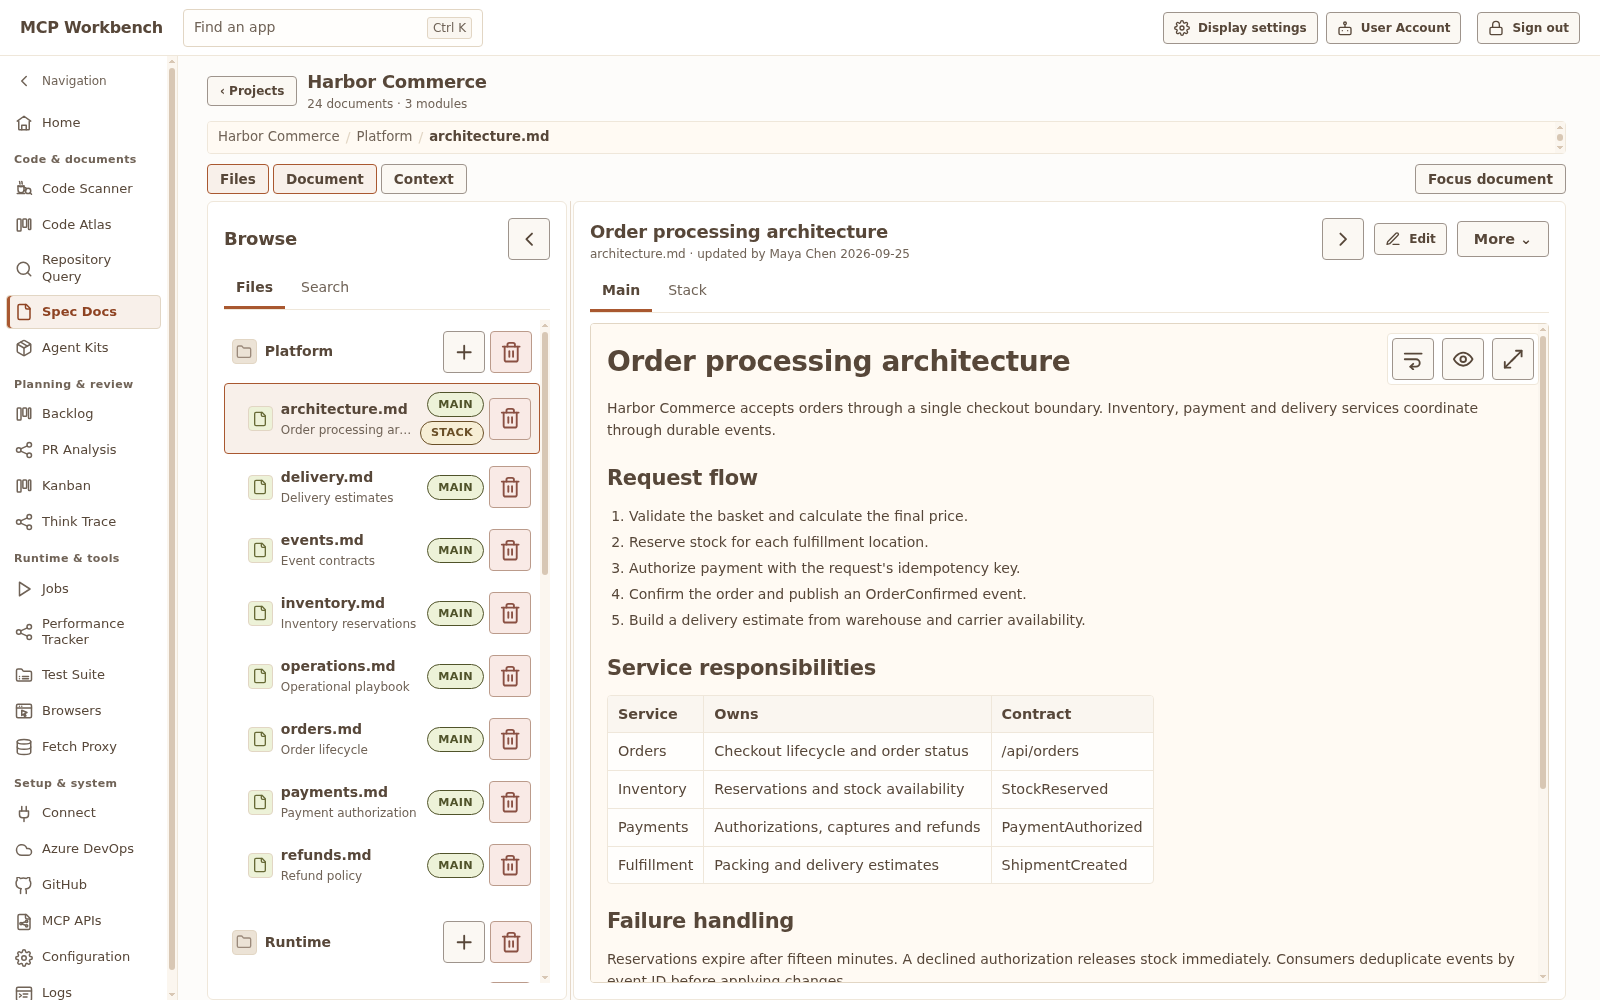
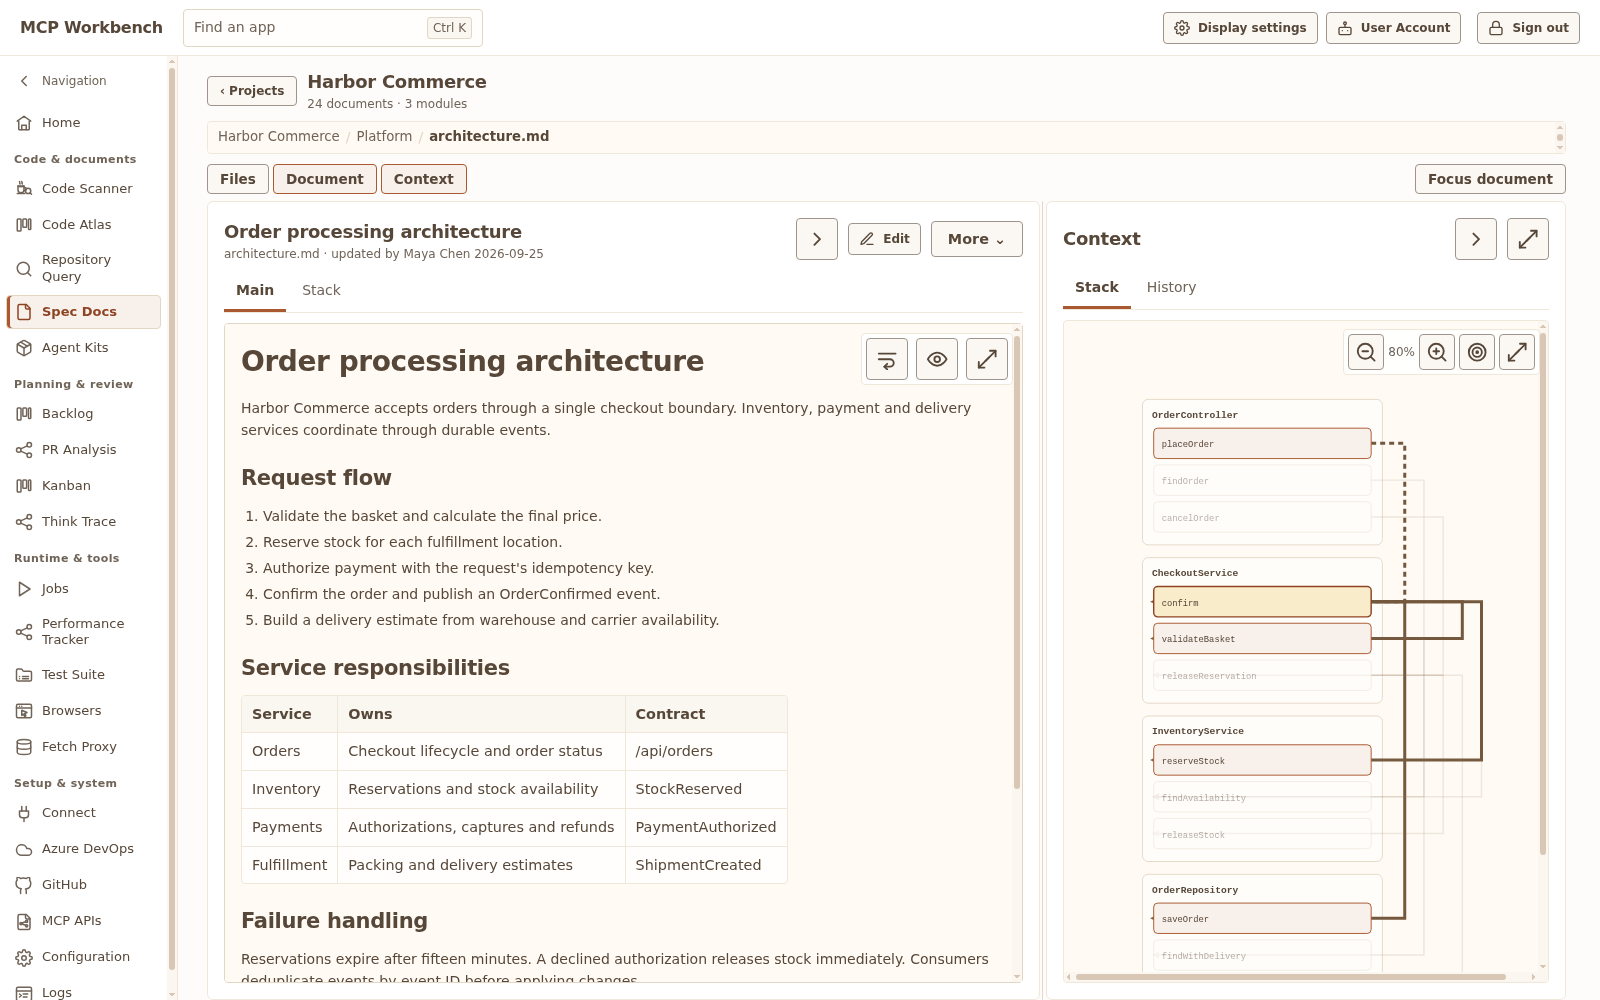
Keep reusable agent instructions, skills and project documentation in folders with search, stable links, version history and Markdown/Mermaid previews. Built-in and Always-on indicators distinguish reusable defaults; editing drafts survive app navigation.
Repository Query
Explore Azure DevOps and GitHub pull requests and commit history with provider-specific filters, current-page grouping, cursor pagination and JSON export. Credential-backed discovery keeps project/owner, repository and target branch explicit.
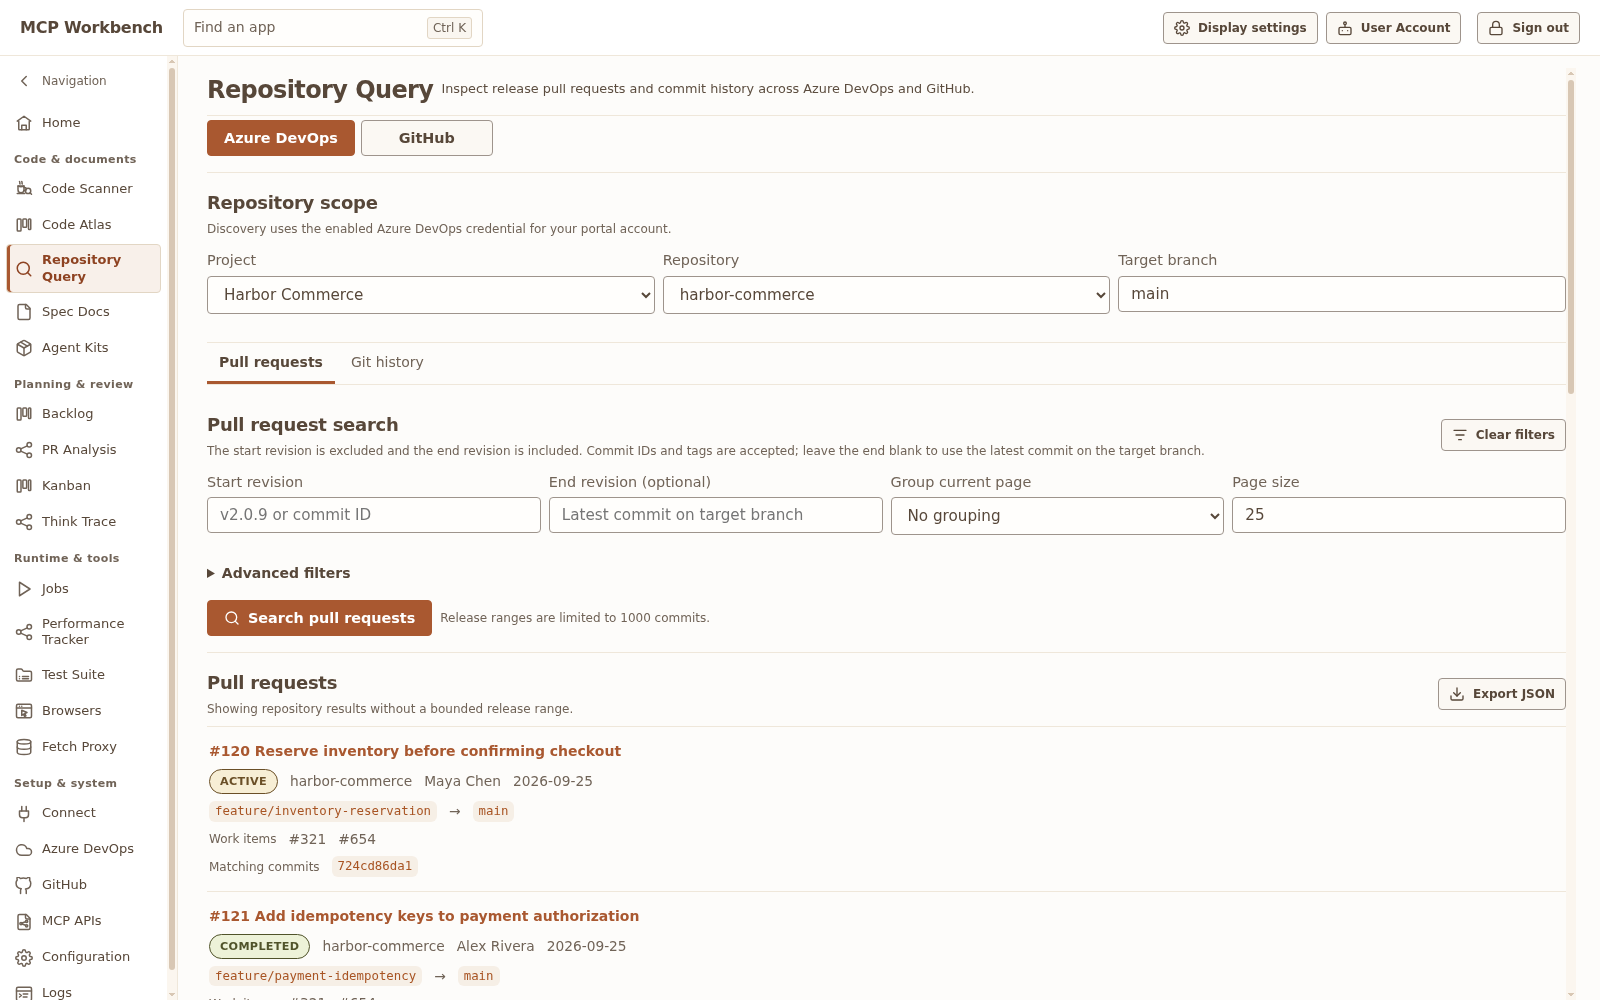
Bound a release with tags or commit IDs. Leave the end revision blank to use the latest commit on the selected branch. History includes associated PRs, and Azure PR reads include their linked work-item IDs.
Code Atlas
See a repository as an interactive map of files, folders or Maven modules. Size tiles by files, physical lines or bytes; color them by committed age, with working-tree changes and unknown history shown separately.
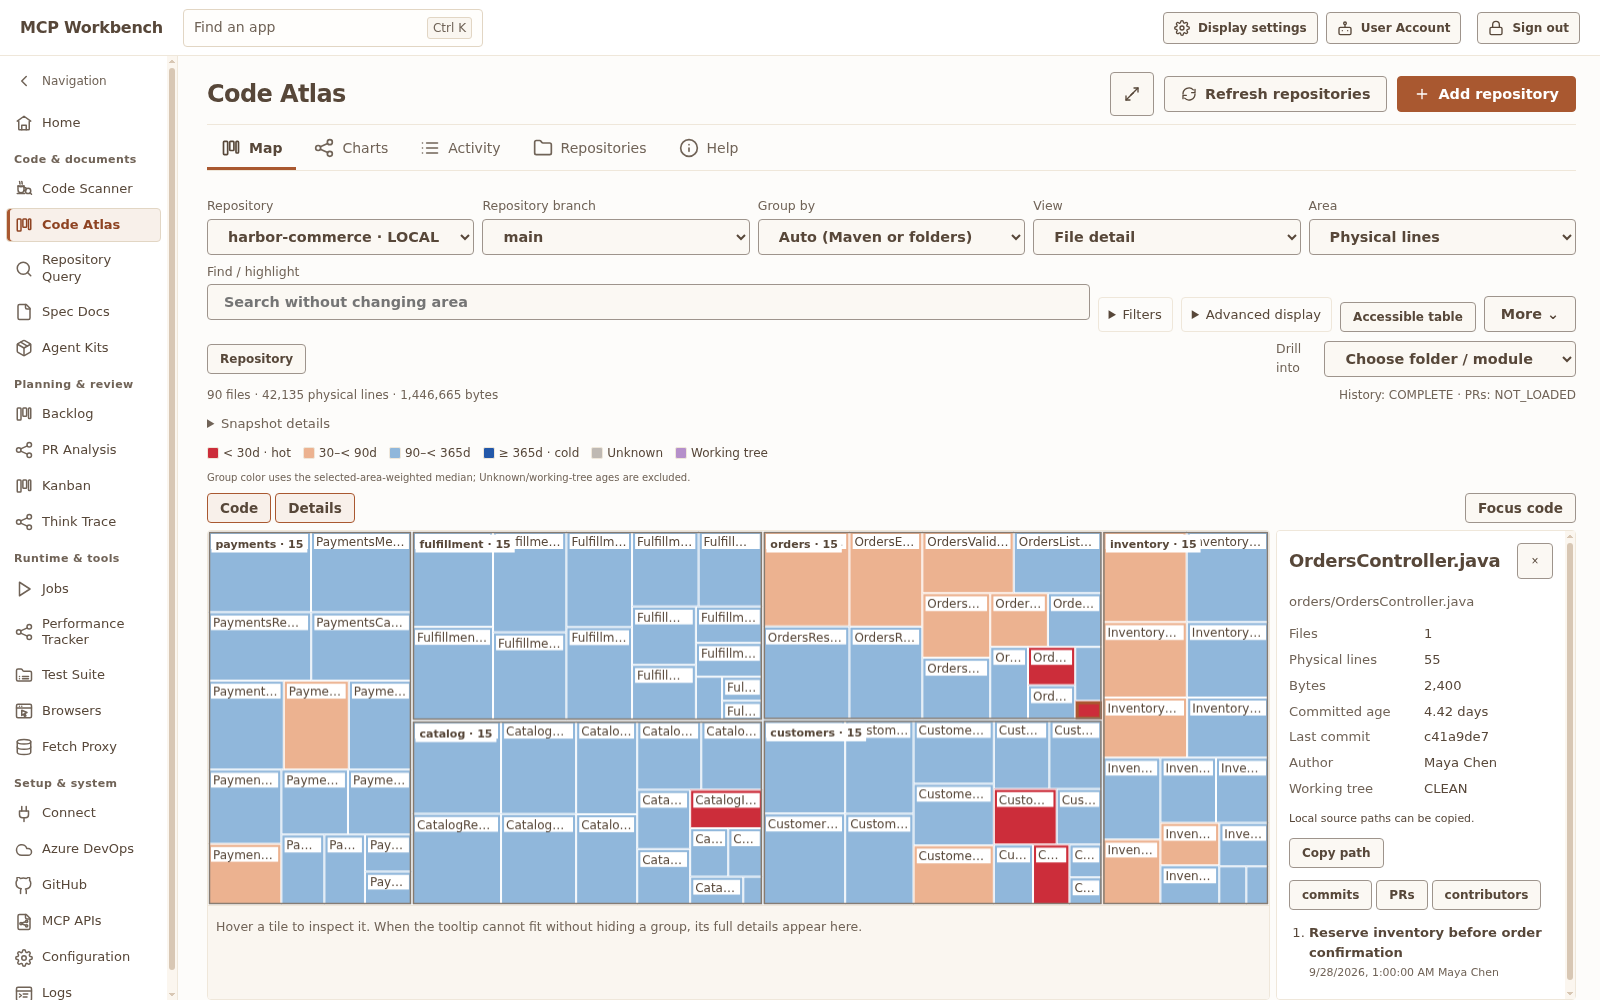
Drill into groups, compare staleness and activity charts, inspect commits, contributors and associated PRs, or use the accessible table and CSV export. Atlas keeps its own source snapshots; Code Scanner supplies the separate semantic analysis.
Code Scanner
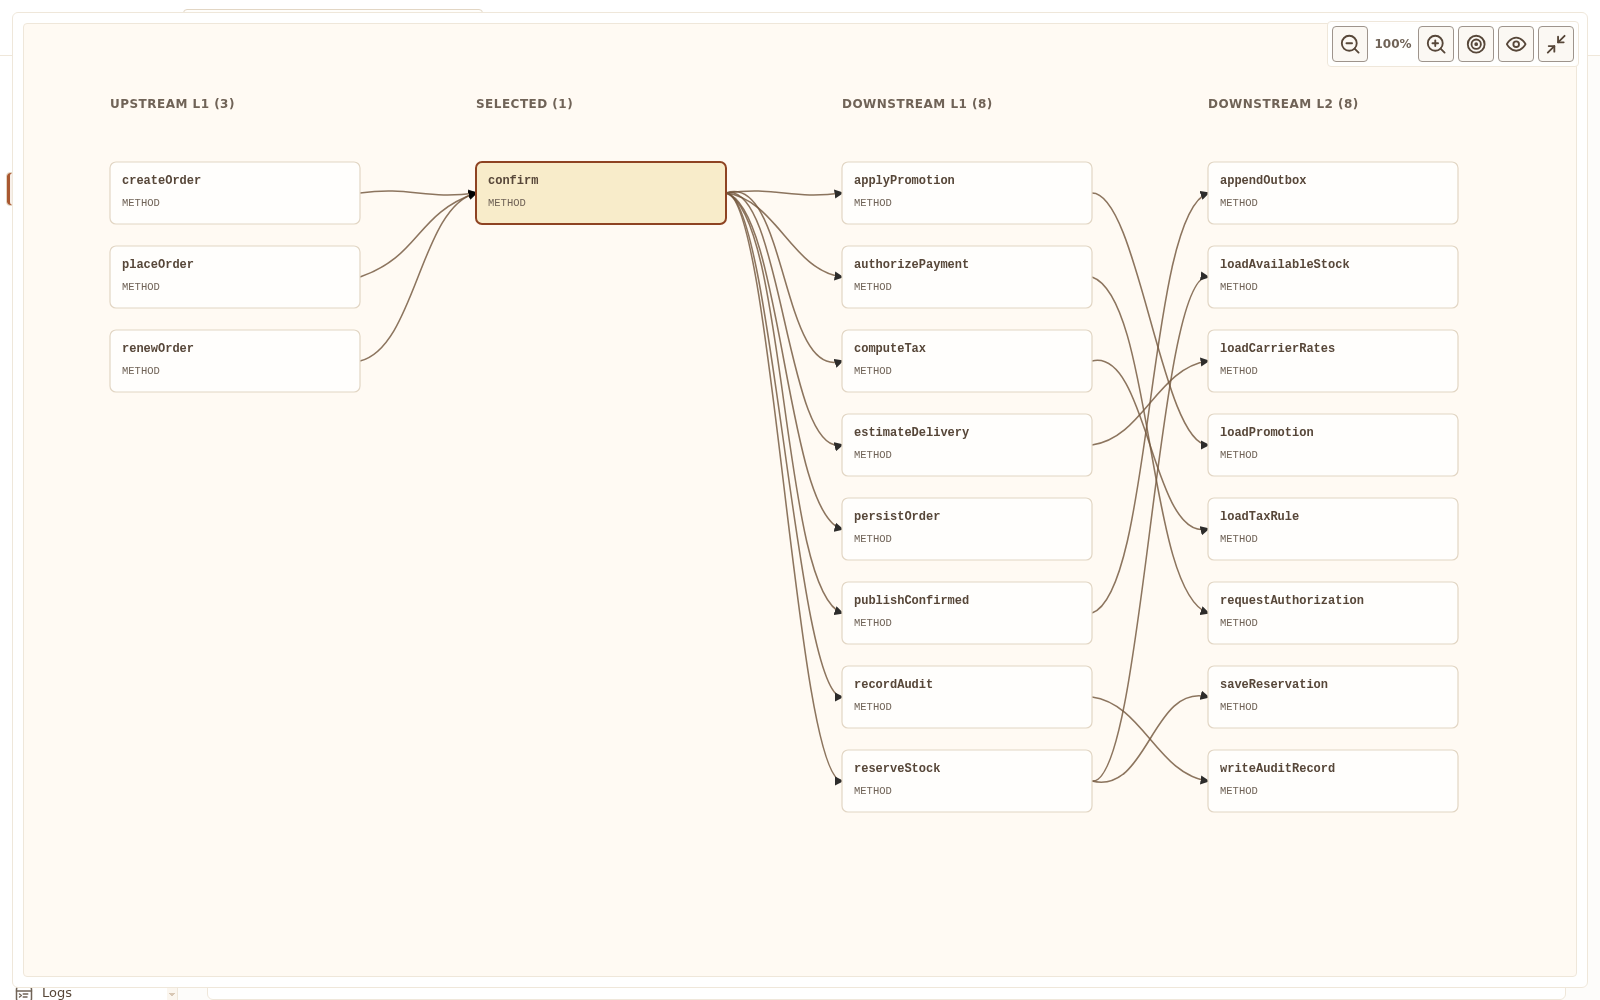
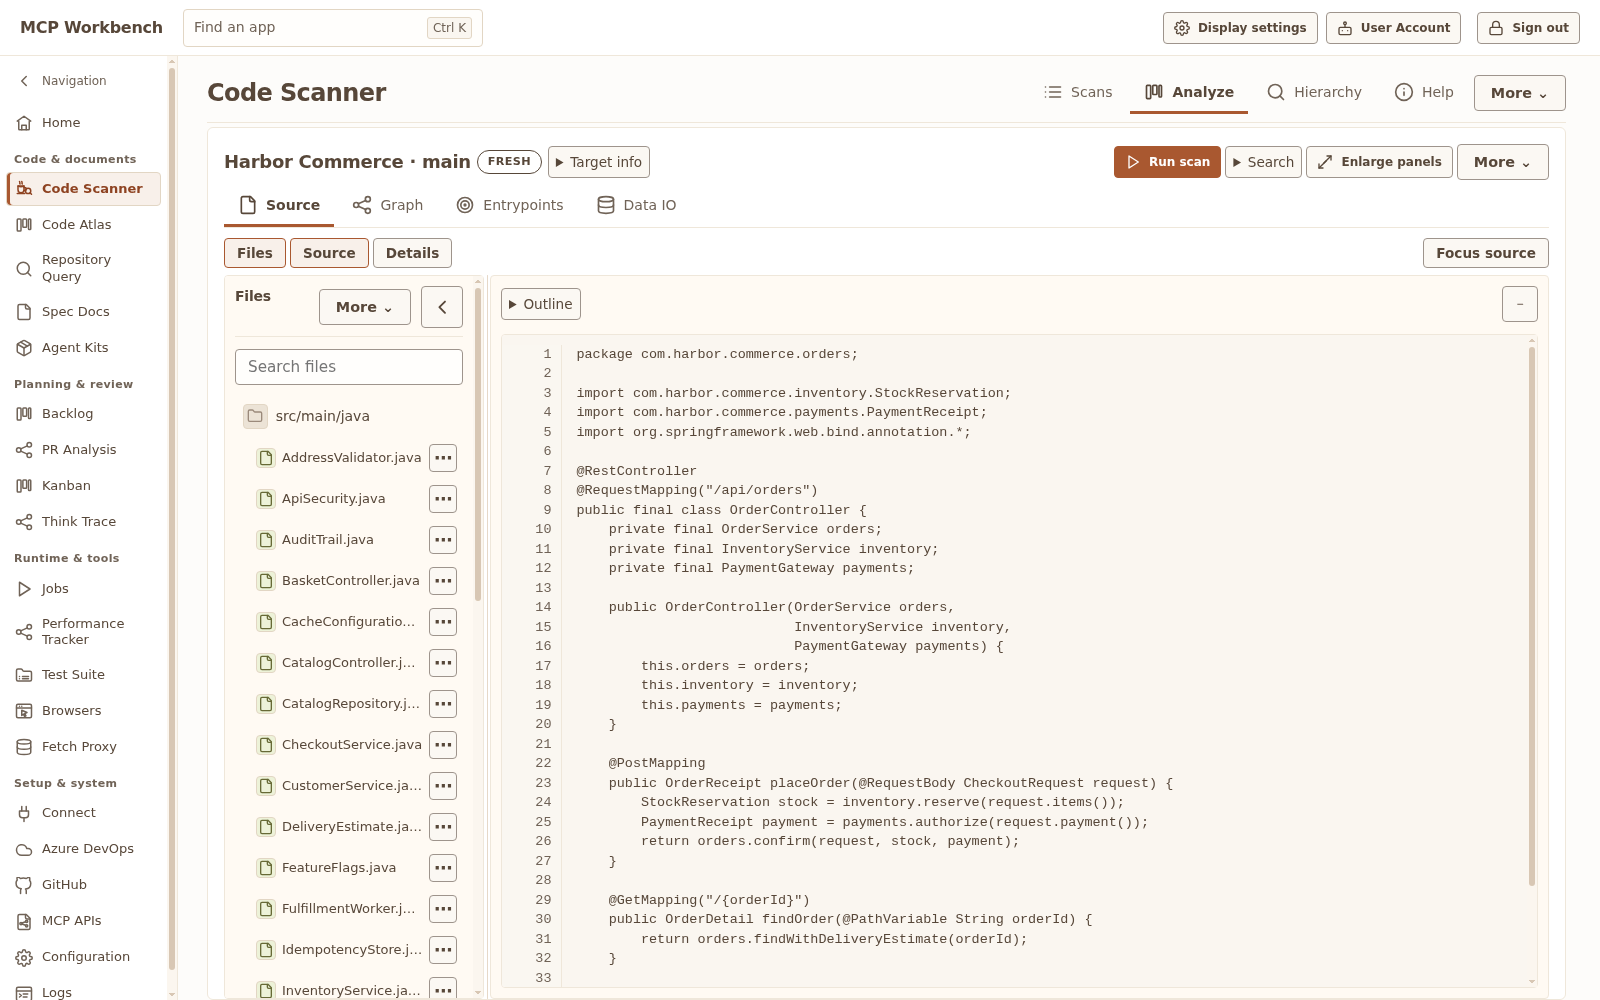
Scan server-local folders or authenticated GitHub and Azure DevOps branches. Analyze Java/Spring symbols, references, call hierarchy and entry points; inspect configuration and Data I/O paths, Maven dependencies and CVE findings, or browser JavaScript/HTML/CSS and UI relationships.
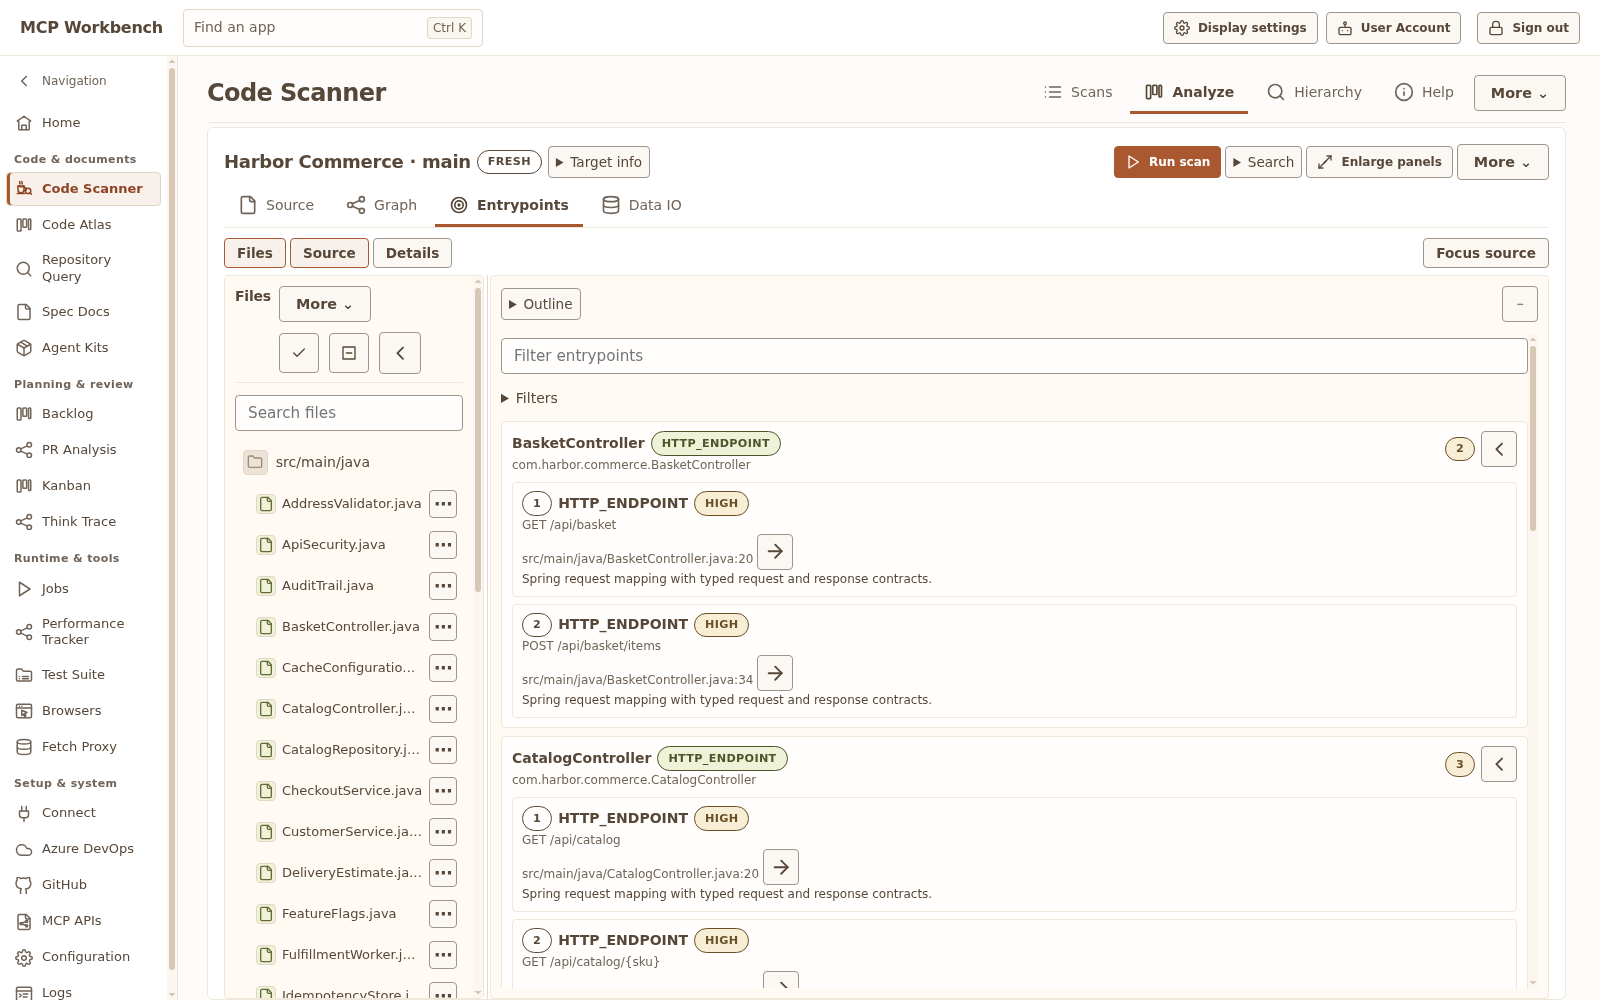
Code Scanner
Recommendations
OrderPricingService#recalculateQuote reaches 5 API entrypoints.
Add partner quote preview and invoice draft regression coverage.
PR #1831 changed the same path 7 days ago.
Move from source to graphs, entry points and findings without losing the selected scope. Static analysis supplies evidence for a review; it does not prove behavior at runtime.
Think Trace
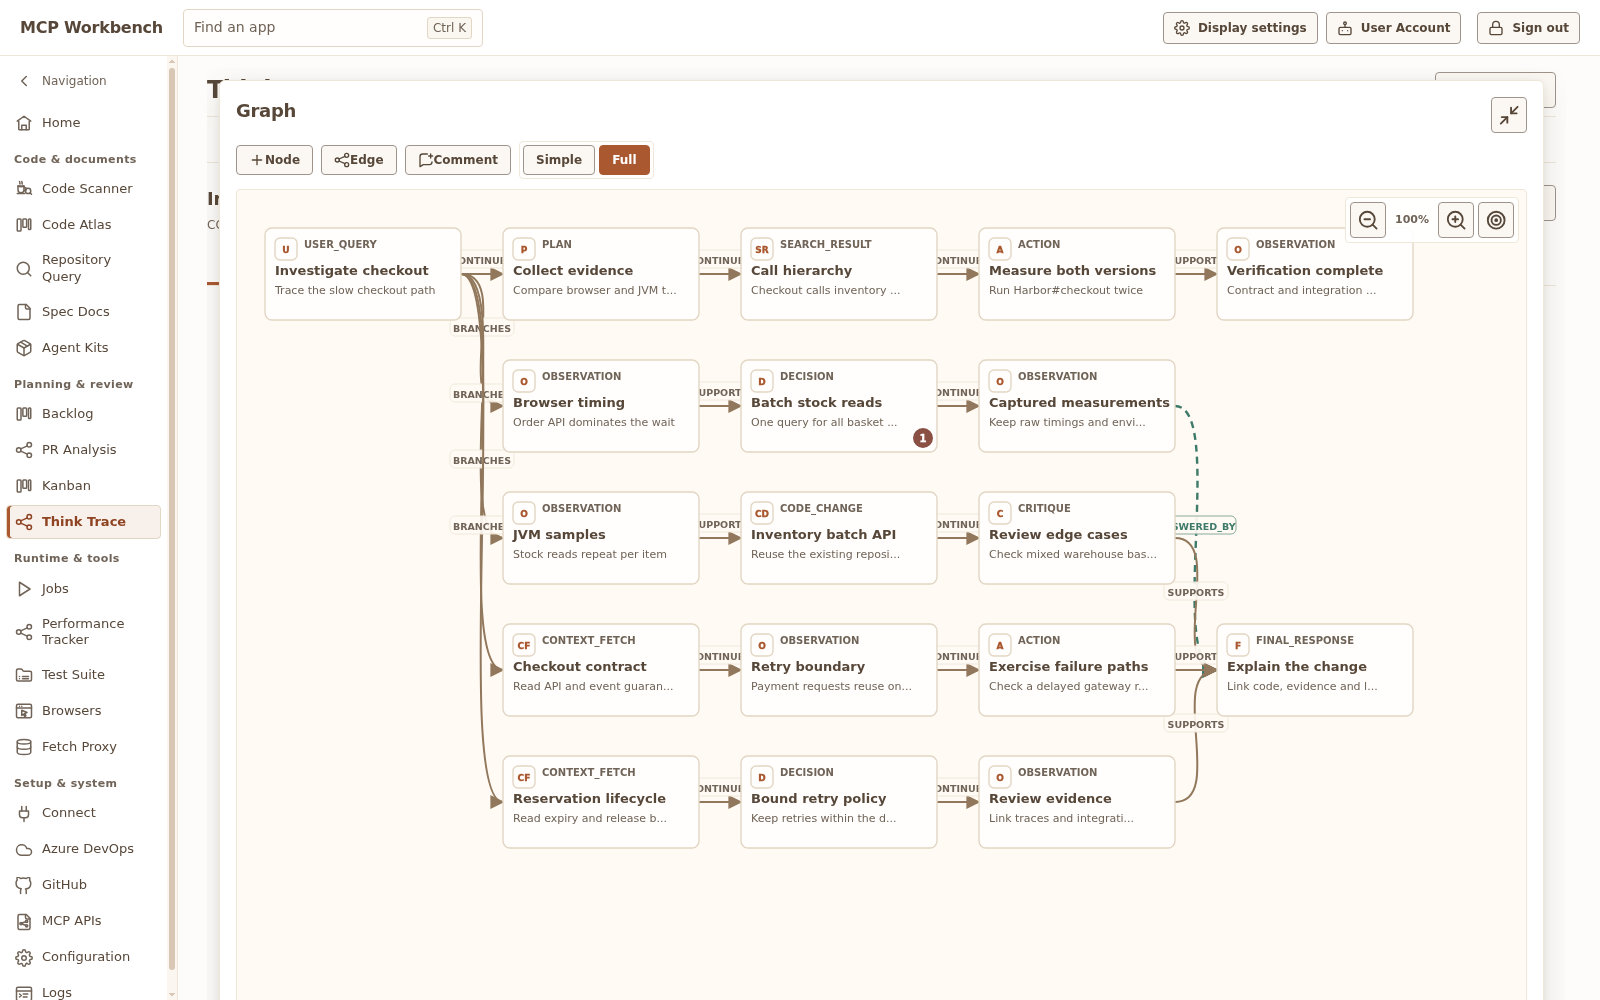
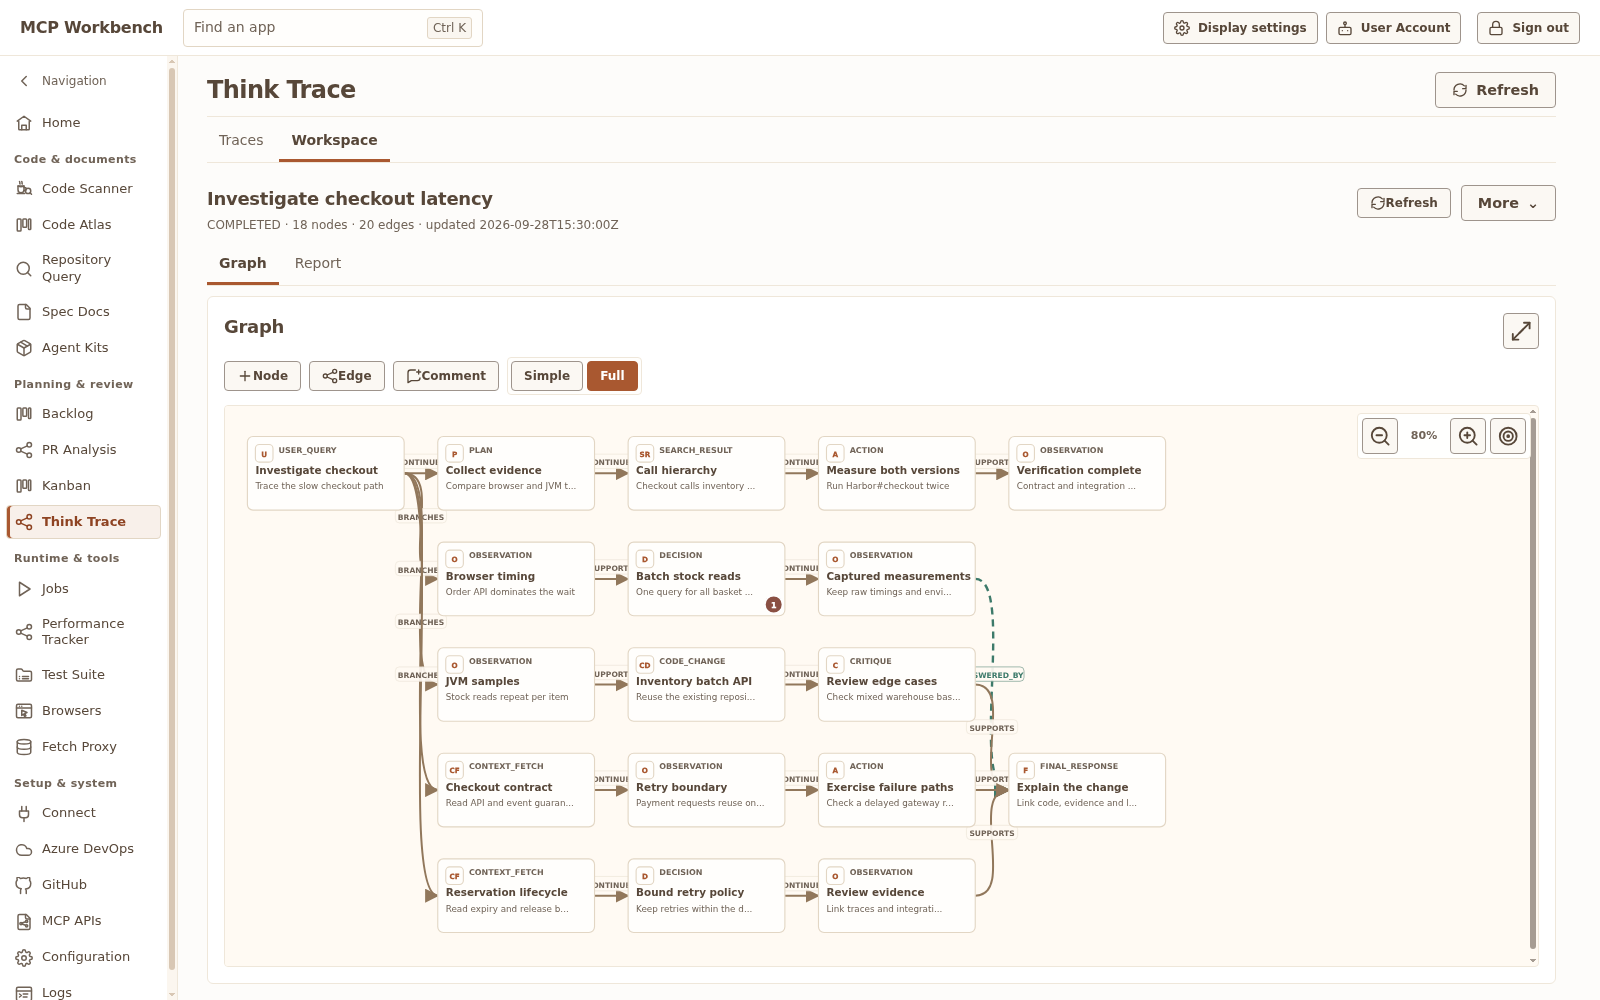
Capture evidence, decisions, comments, and final responses as a graph-backed handoff that avoids storing private raw chain-of-thought.
MCP APIs and portal links
Agents can create cards, traces, proposals, and analysis records, then return stable local links for you to inspect.
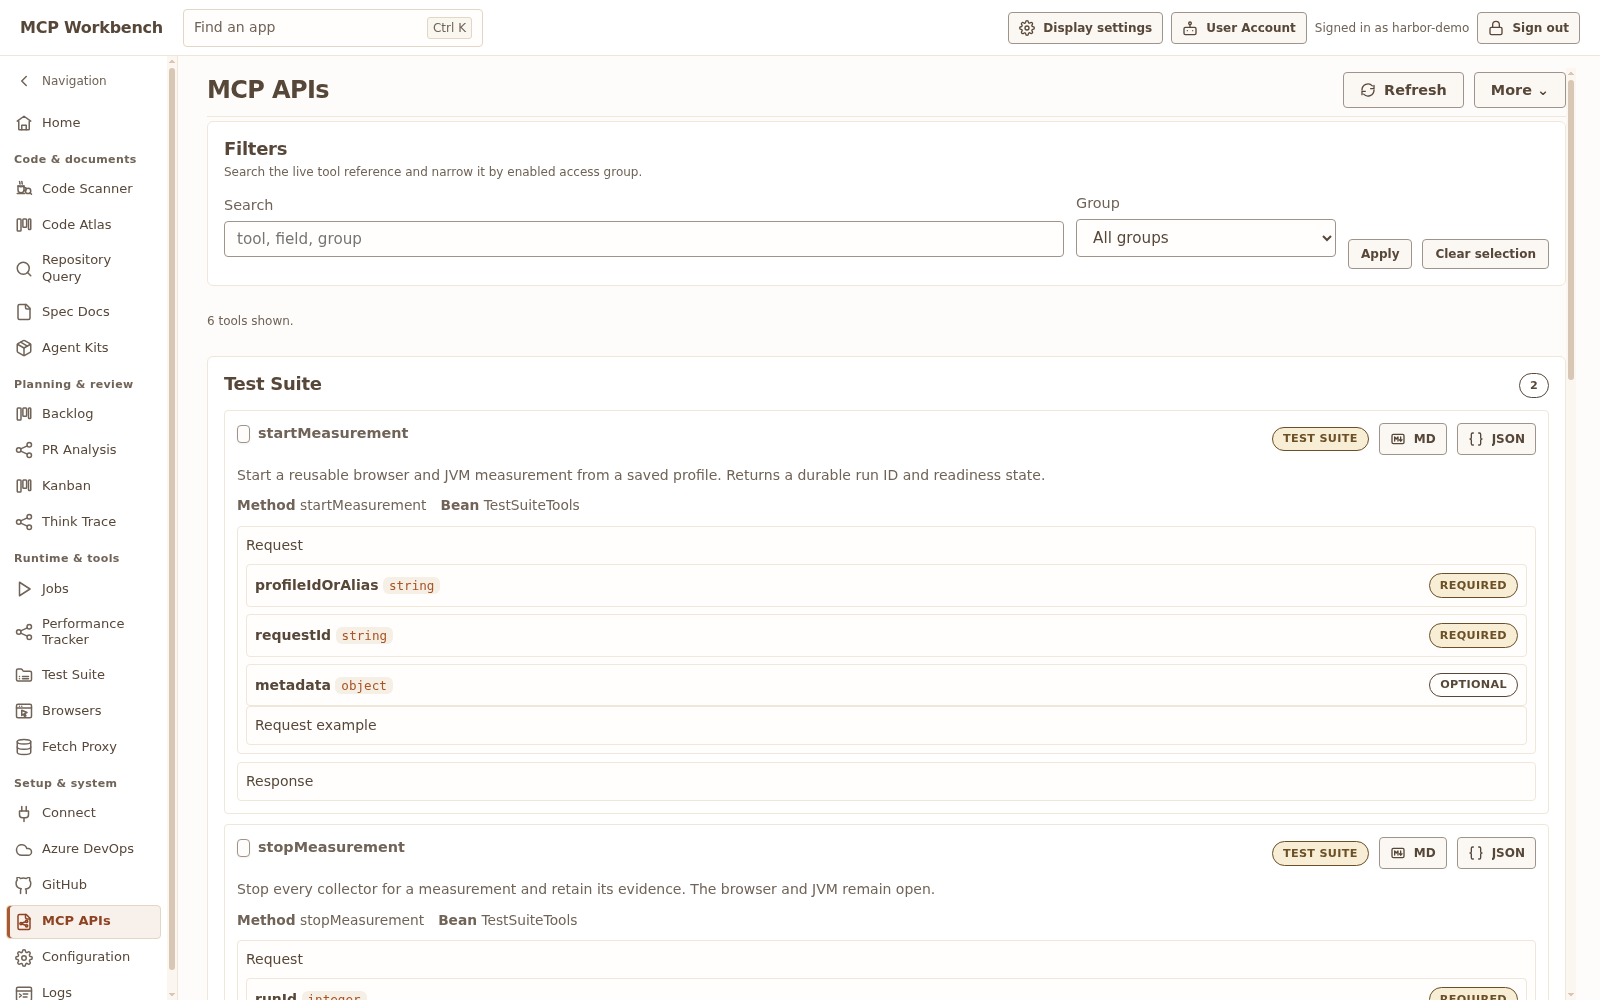
Logs, configuration, and database
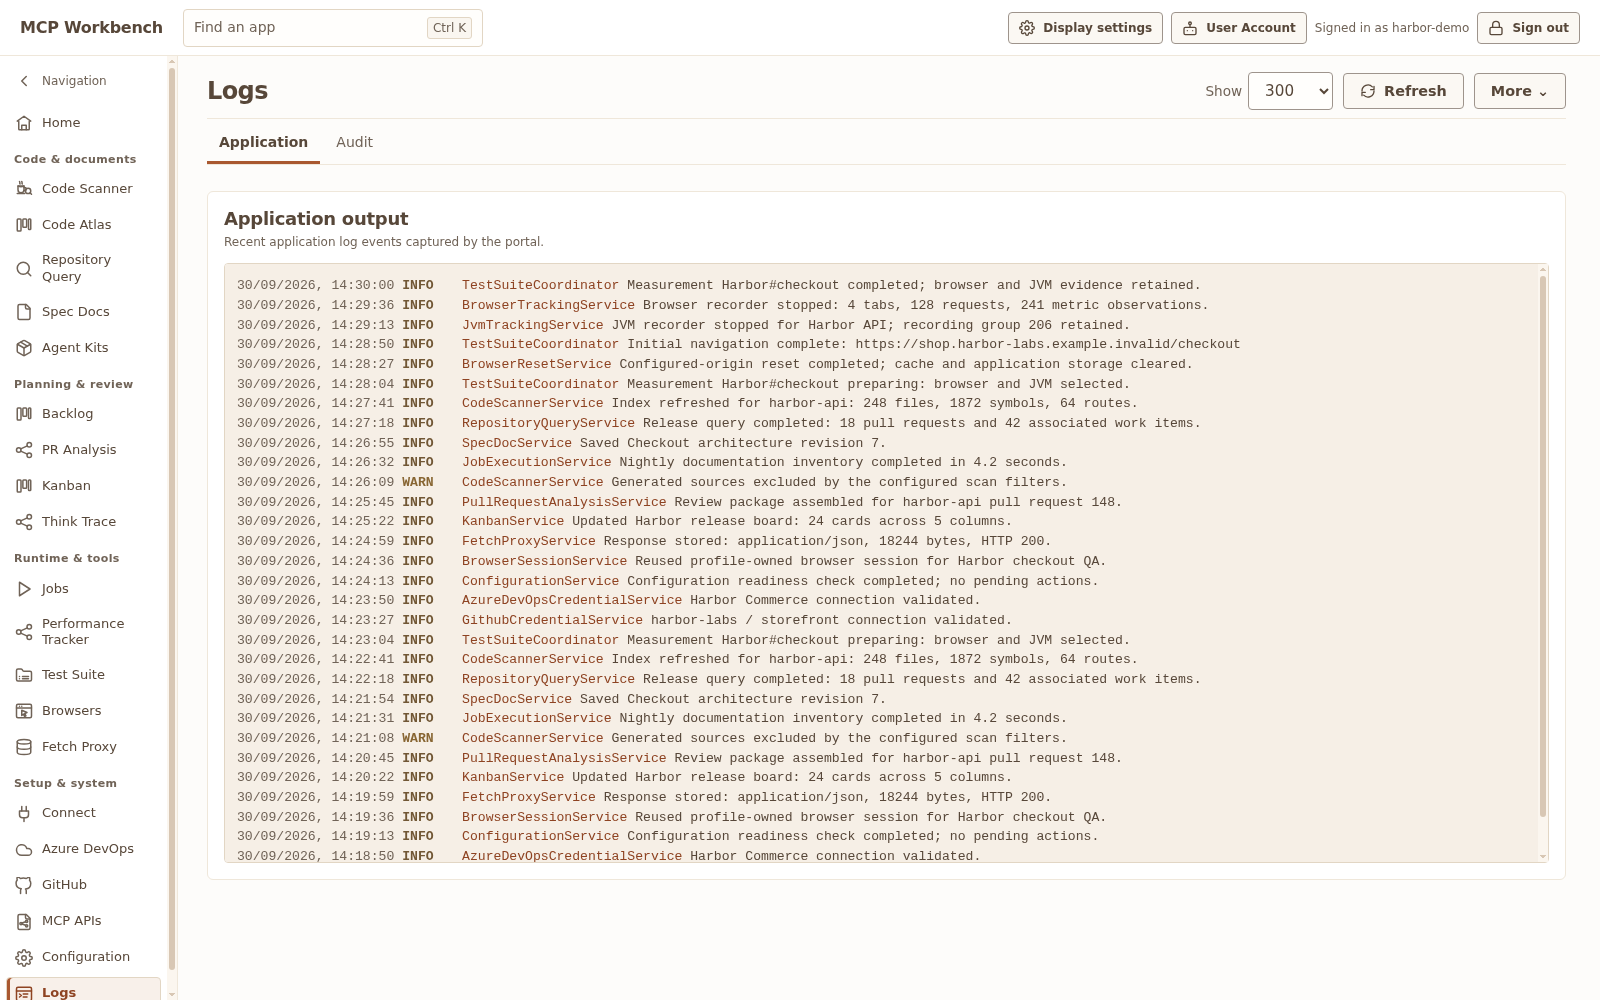
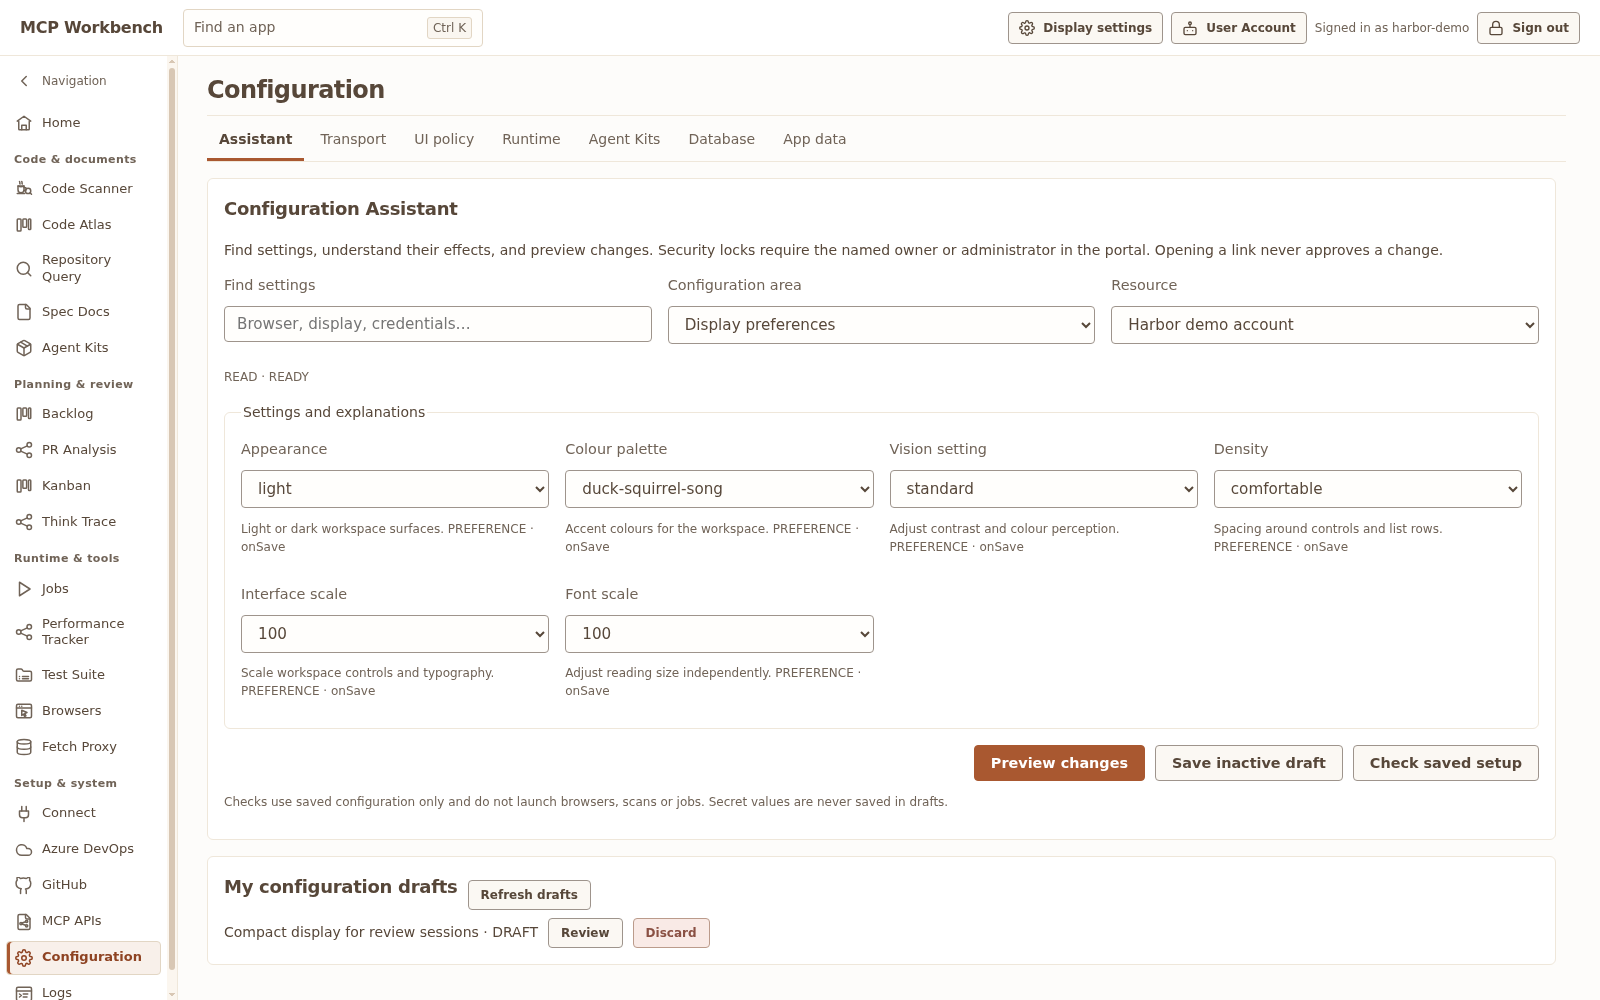
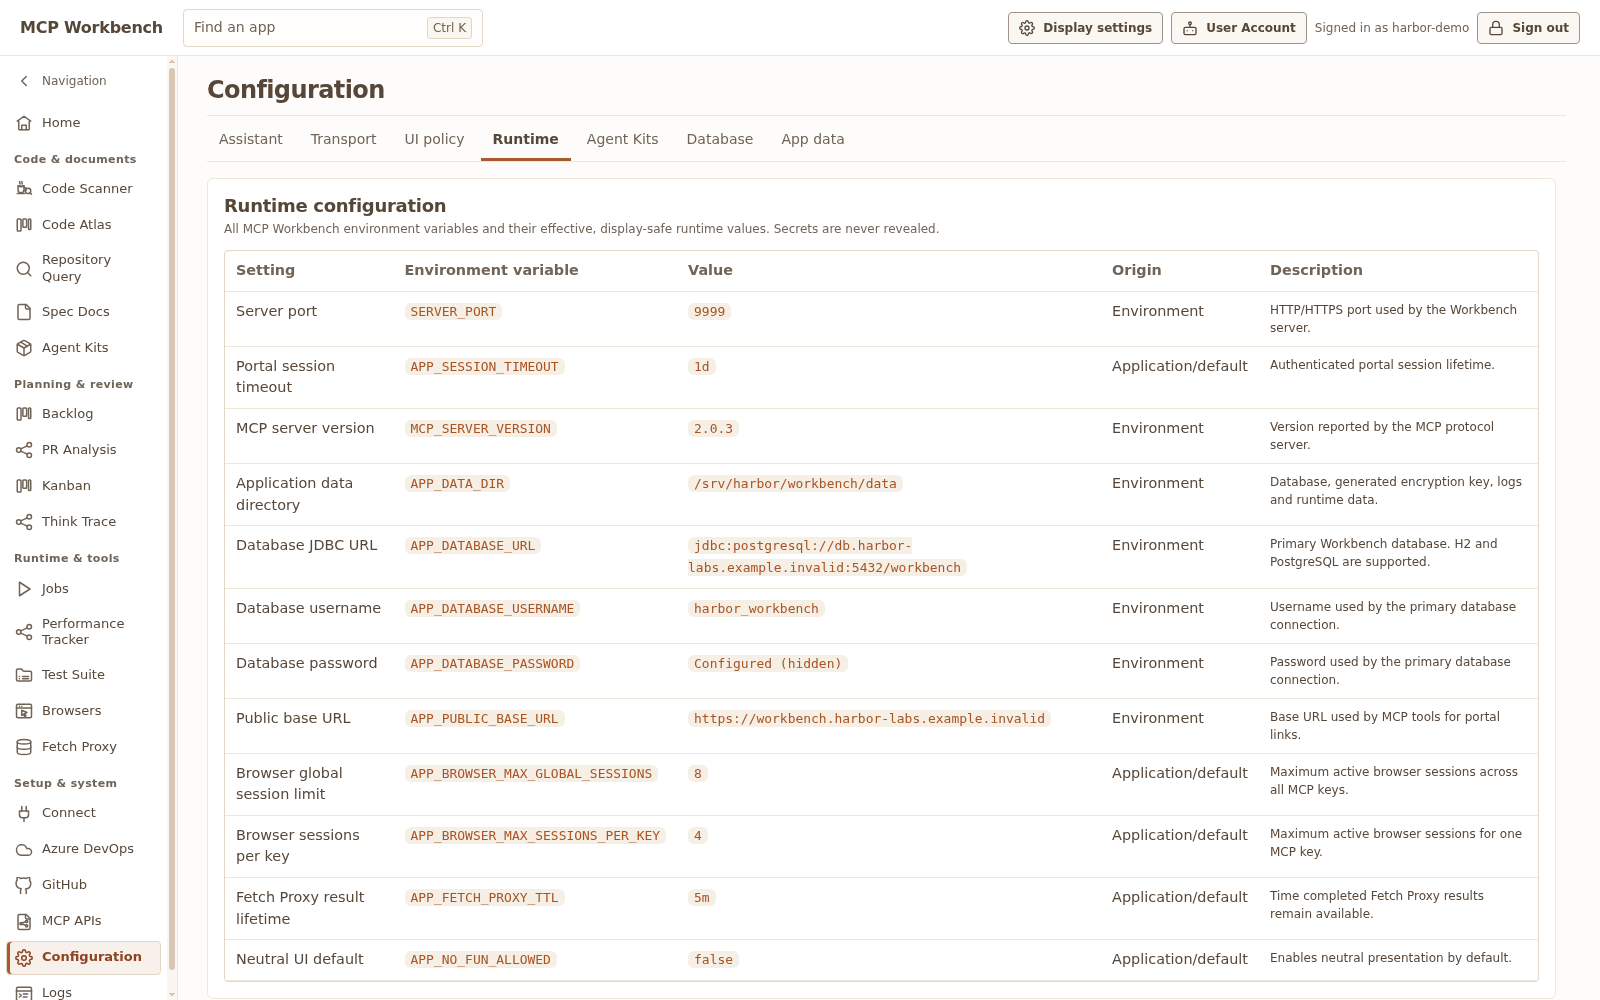
Inspect local logs and audit history, manage users and credentials, and choose H2 or PostgreSQL storage. Configuration Assistant provides discoverable settings, read-only setup checks, reviewable previews and inactive drafts. Protected grants and global policy stay human-controlled. Database tools compare schemas before selected imports; recordings and Test Suite data retain their separate lifecycle protections.
Display preferences and Neutral UI
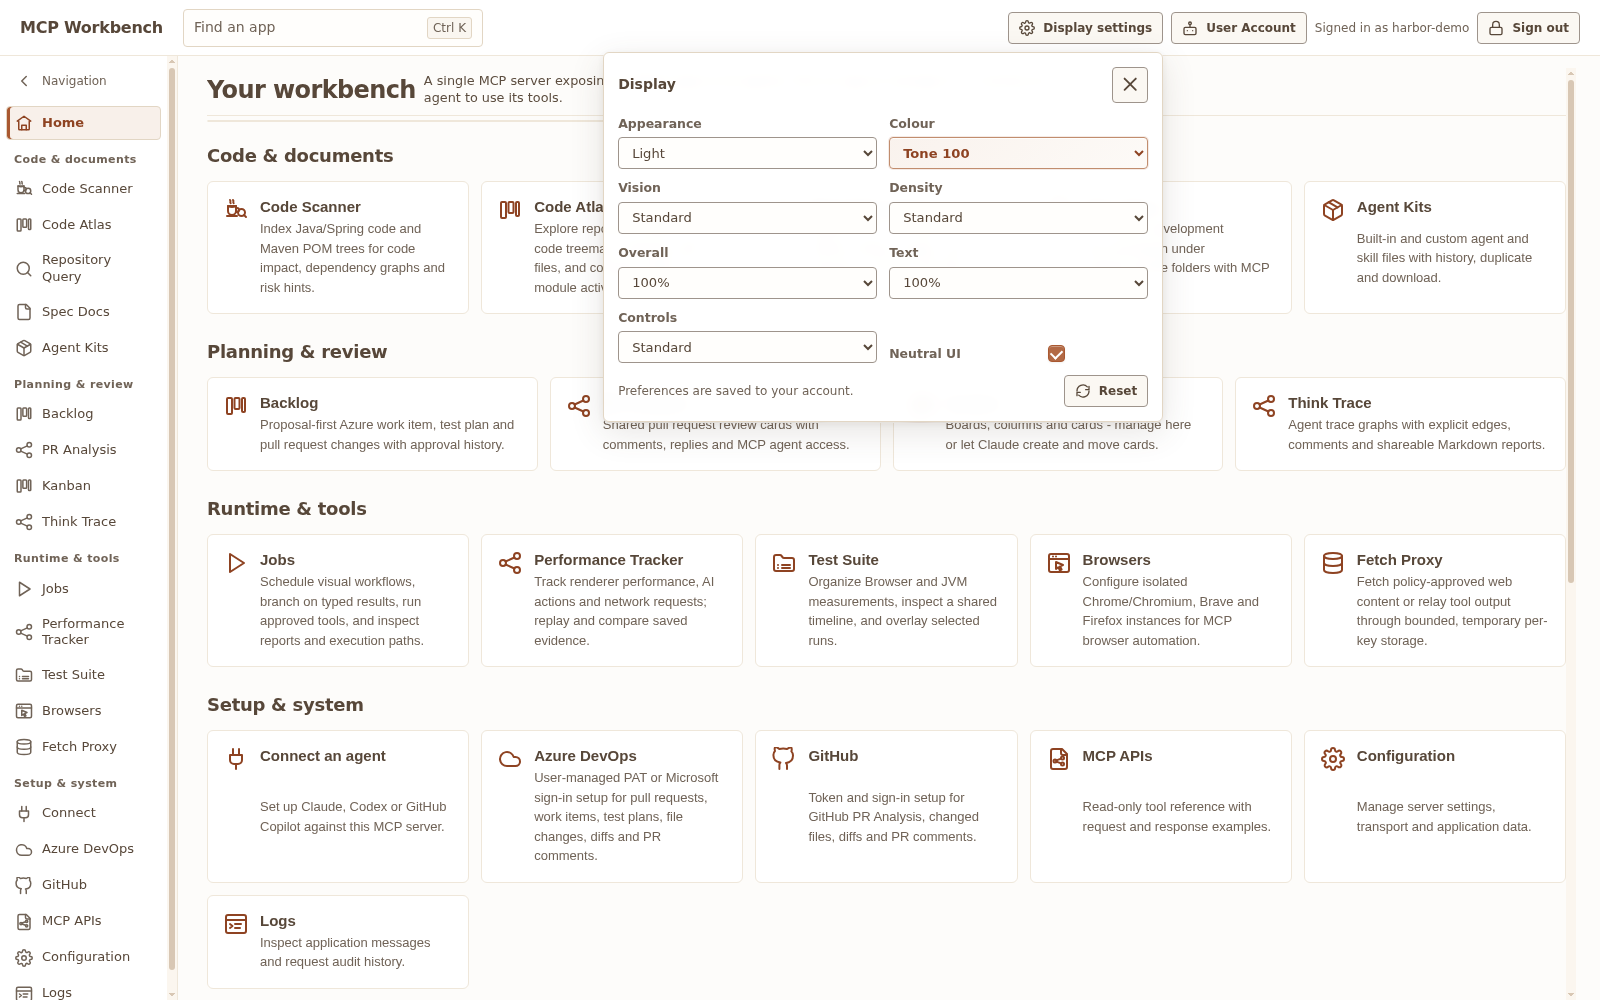
Choose light or dark appearance, color palettes, vision settings, density and interface scaling. Administrators can enforce a restrained Neutral UI presentation. The loading duck remains visible; grouped navigation, the searchable Ctrl/Cmd+K app switcher and adaptive panes support full or half-width desktop work.
Measure and automate
Measure changes. Keep the evidence.
Test Suite organizes the scenario. Performance Tracker retains the evidence. Jobs runs the workflows you explicitly configure.
Test Suite
Organize browser, JVM or combined measurement profiles in folders such as Harbor/sortB. Reuse Harbor#sortB to start another run and keep its evidence together.
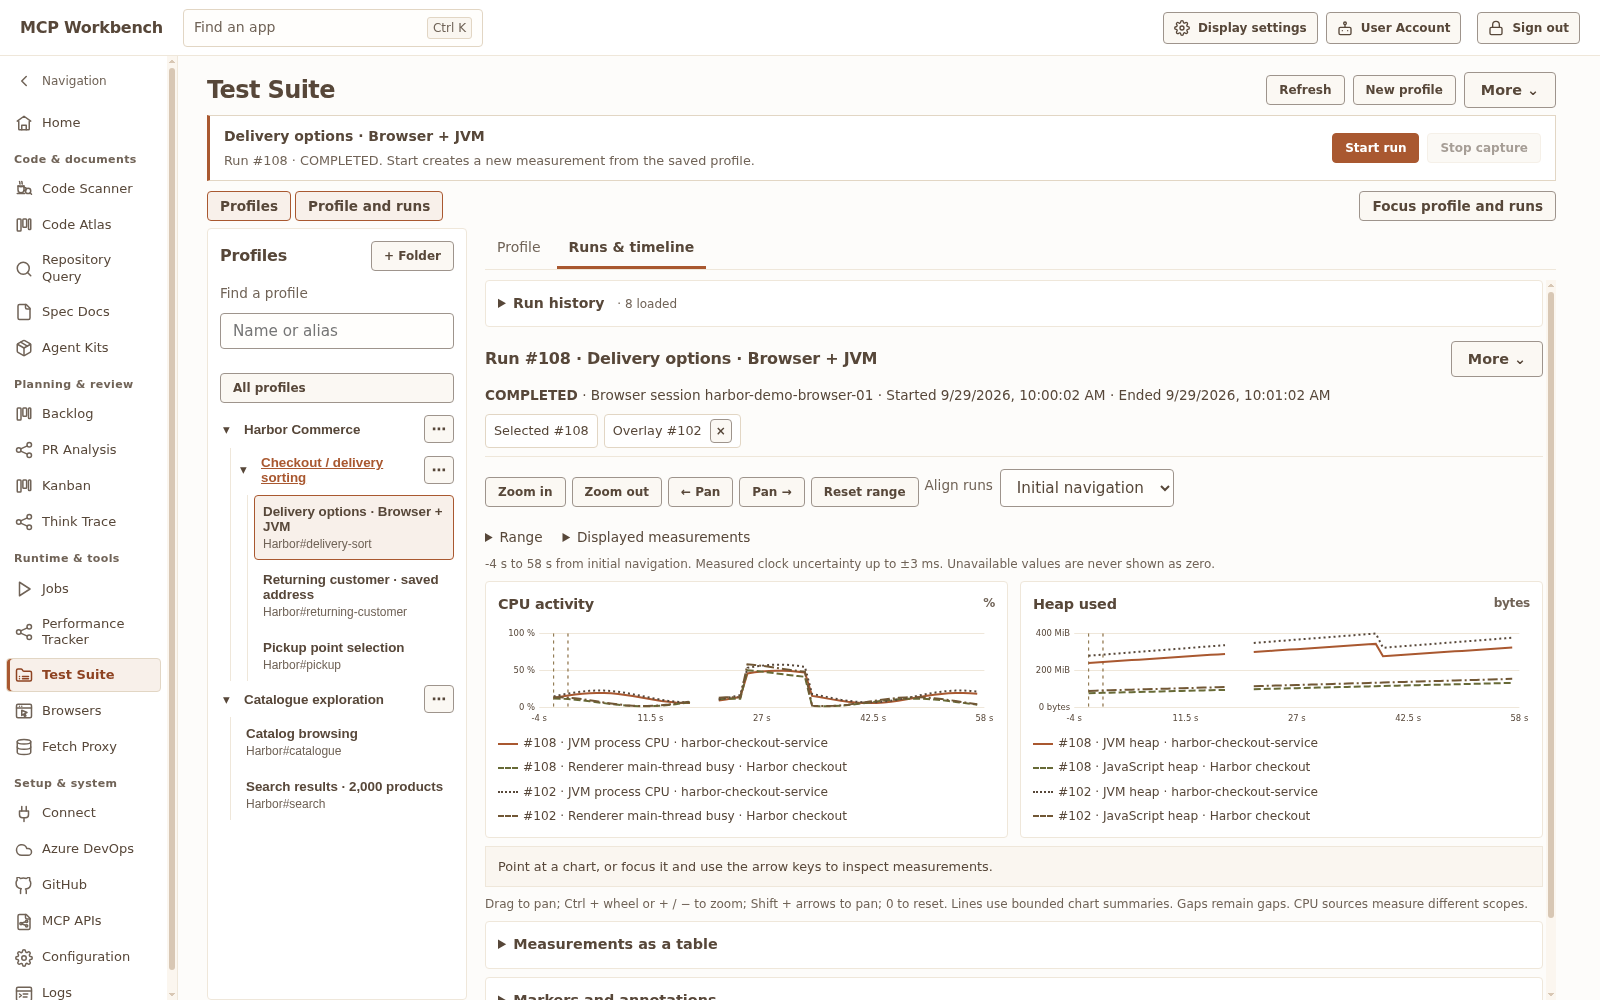
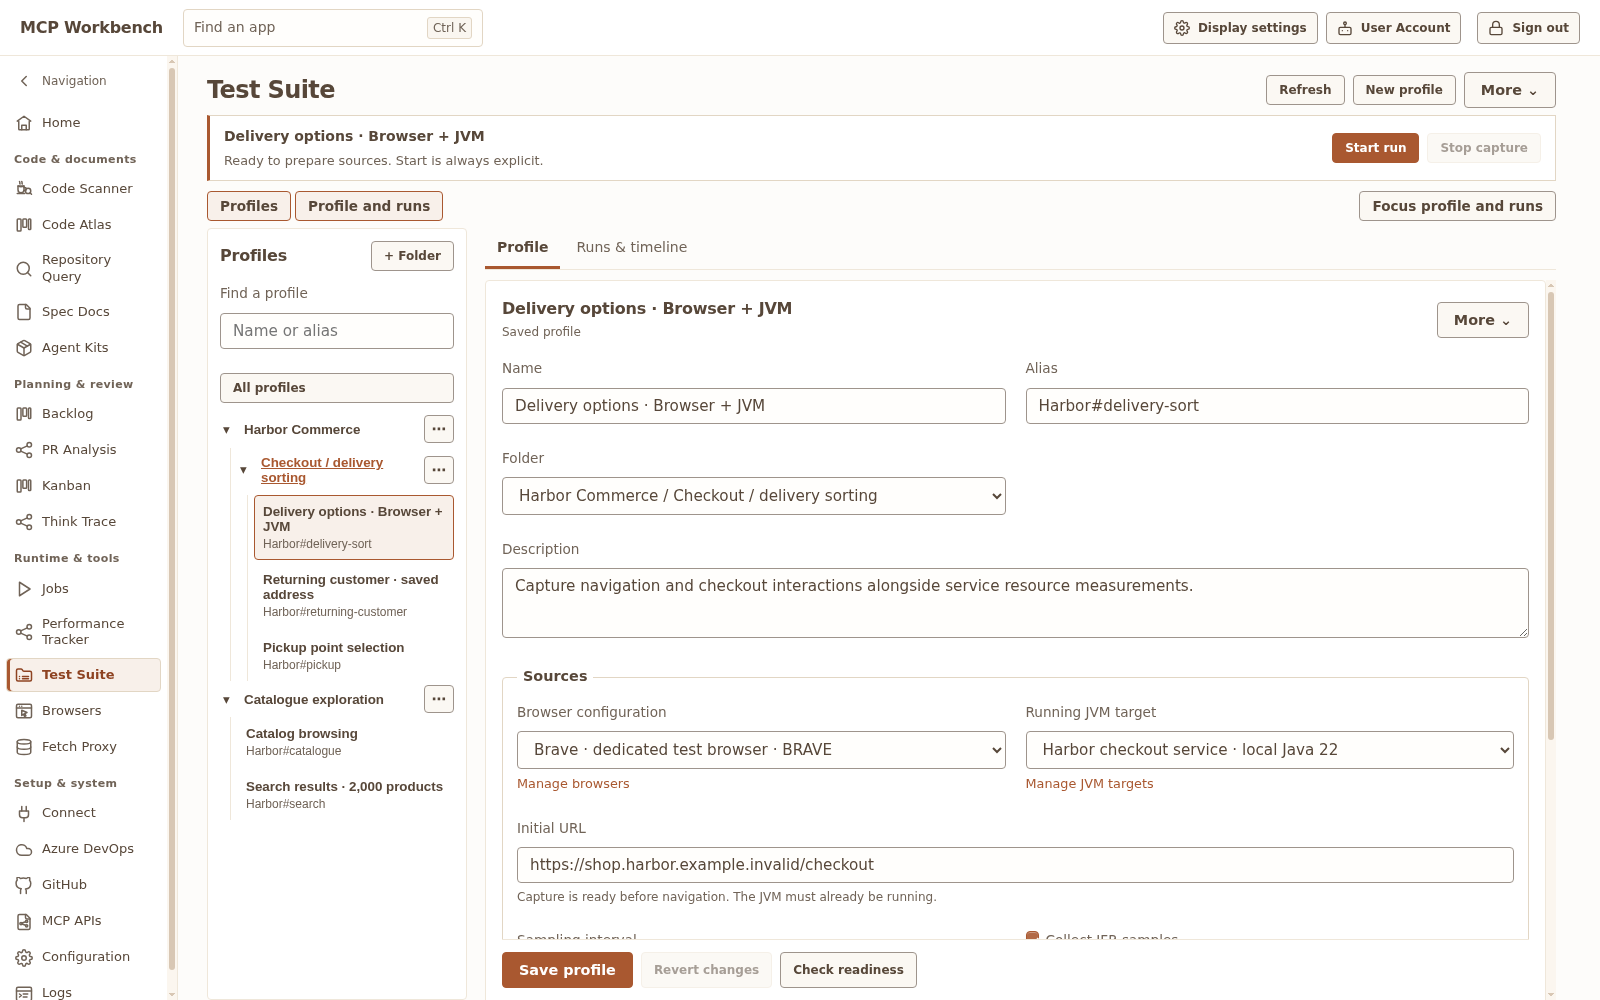
Start by alias, wait for interaction readiness, use the existing browser tools, then stop by the returned run ID. Workbench resets the configured site data before capture and starts every selected collector before the measured initial navigation. Stop leaves the browser and application open.
Compare repeated runs on a shared timeline with navigation markers, synchronized zoom and an accessible data table. Each run keeps its immutable profile snapshot, environment manifest and your build, commit or dataset labels. Metadata distinguishes observed target information from supplied labels and explicitly marks unavailable hardware fields.
Reusable measurement, not an automated test verdict. Initial browser profiles use local Chrome/Brave definitions; complete Firefox and remote-helper reset are not supported. JVM targets attach to an already running, approved application.
Performance Tracker · Browser
Record browser activity across all tabs, the selected tab or one pinned tab. Align supported CPU, JavaScript heap and DOM/layout observations with browser actions and request metadata, then inspect live or saved evidence with pause, playback, seeking, annotations and JSON/CSV export.
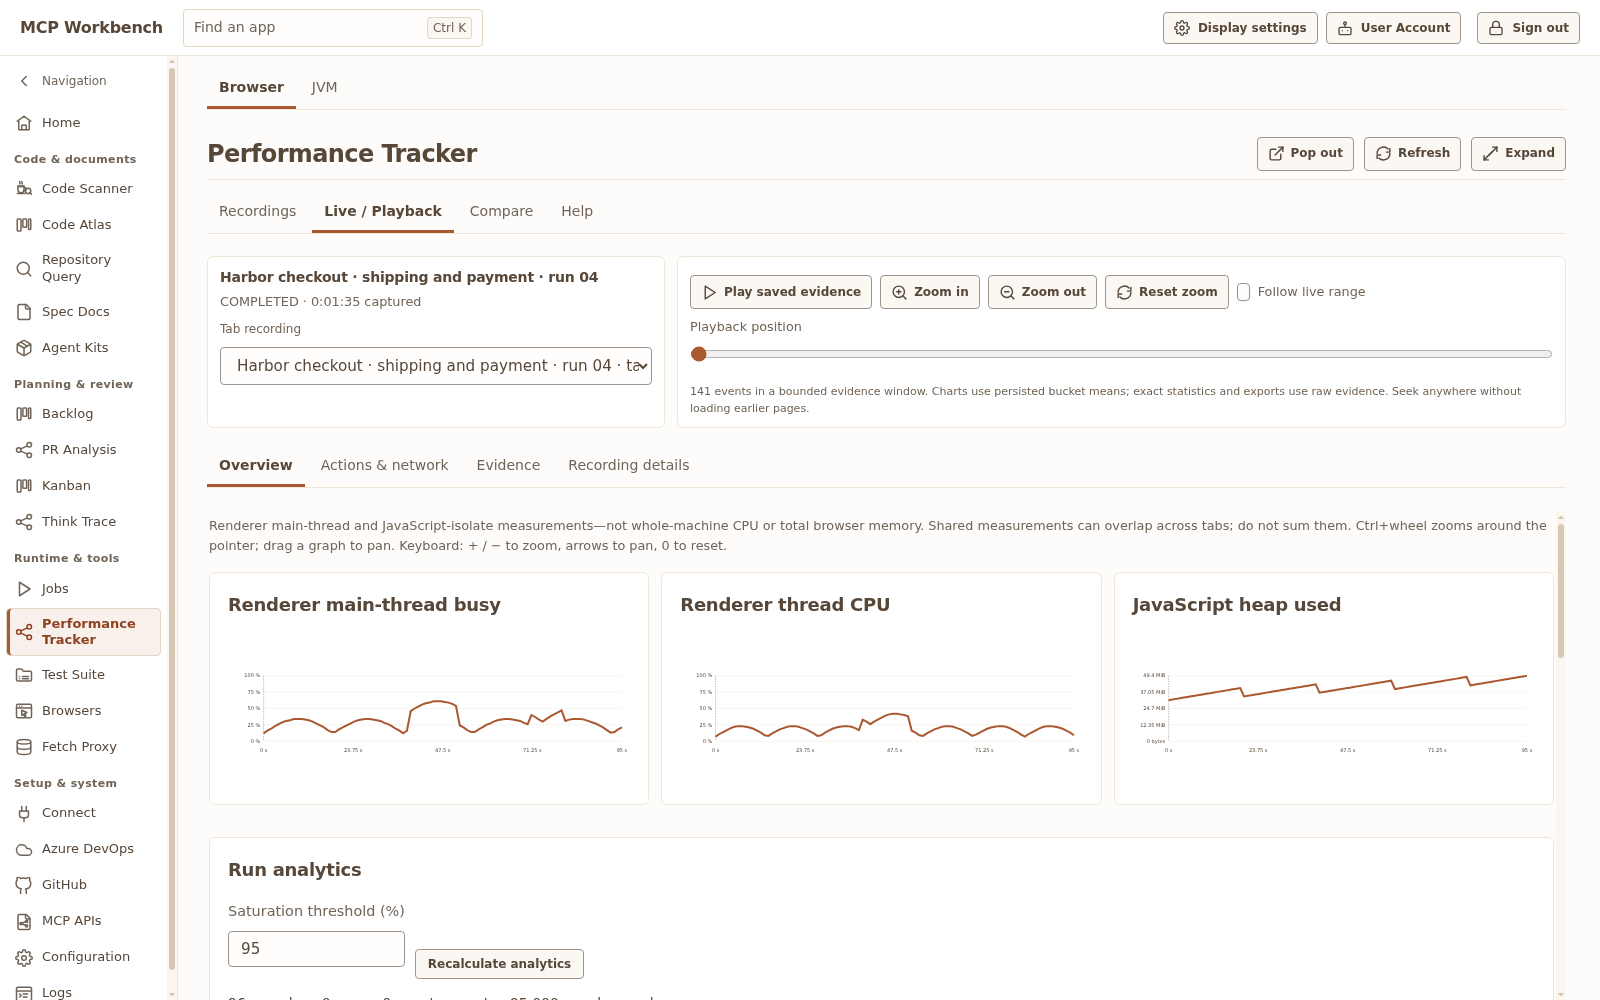
Capture a screenshot or HTML snapshot explicitly; optional HTML and network payload capture remain permission-controlled. Missing samples remain gaps, and tab readings are not added into an invented browser-wide total. Saved playback never repeats actions or requests.
Use the recording list or Storage Atlas to explore sessions and their telemetry, artifacts and indexes. Locks protect evidence from ordinary deletion; explicit recording controls remain available in dedicated popouts.
Performance Tracker · JVM
Connect an approved local JVM or saved JMX target. Restart-following targets identify the application without relying on a fixed PID. Observe process CPU, heap and memory pools, garbage collection, classes and platform-thread states over the recording timeline.
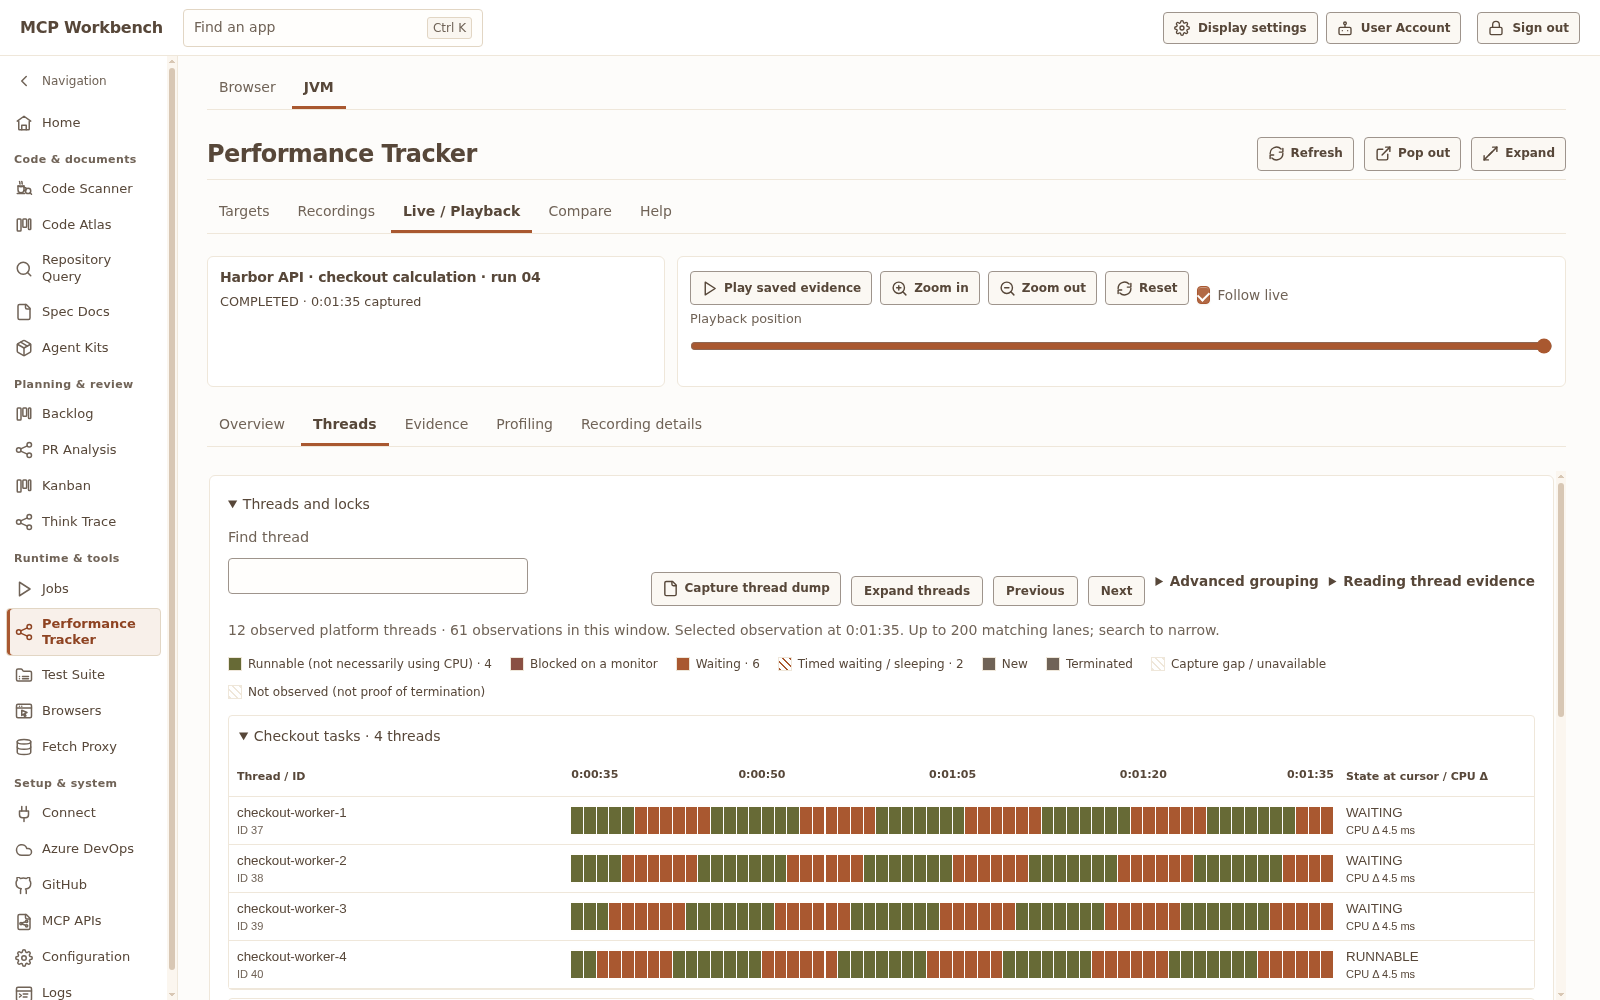
Capture thread dump provides explicit stack evidence. Optional JFR adds sampled execution, allocation, GC and contention evidence; method profiling uses a separately installed agent, a scope preview and an explicit Start. Thread states alone do not establish CPU use.
Inspect class histograms or heap dumps with the bundled analysis worker: dominators, retained sets, paths to roots and histogram comparisons. Impact acknowledgements and diagnostic permissions remain required; healthy captures have no fixed duration ceiling.
Jobs and AI provider testing
Build and validate visual workflows from triggers, actions, conditions and reports. Schedule them with a timezone, inspect execution history and audit events, and keep run controls visible beside the graph and node inspector.
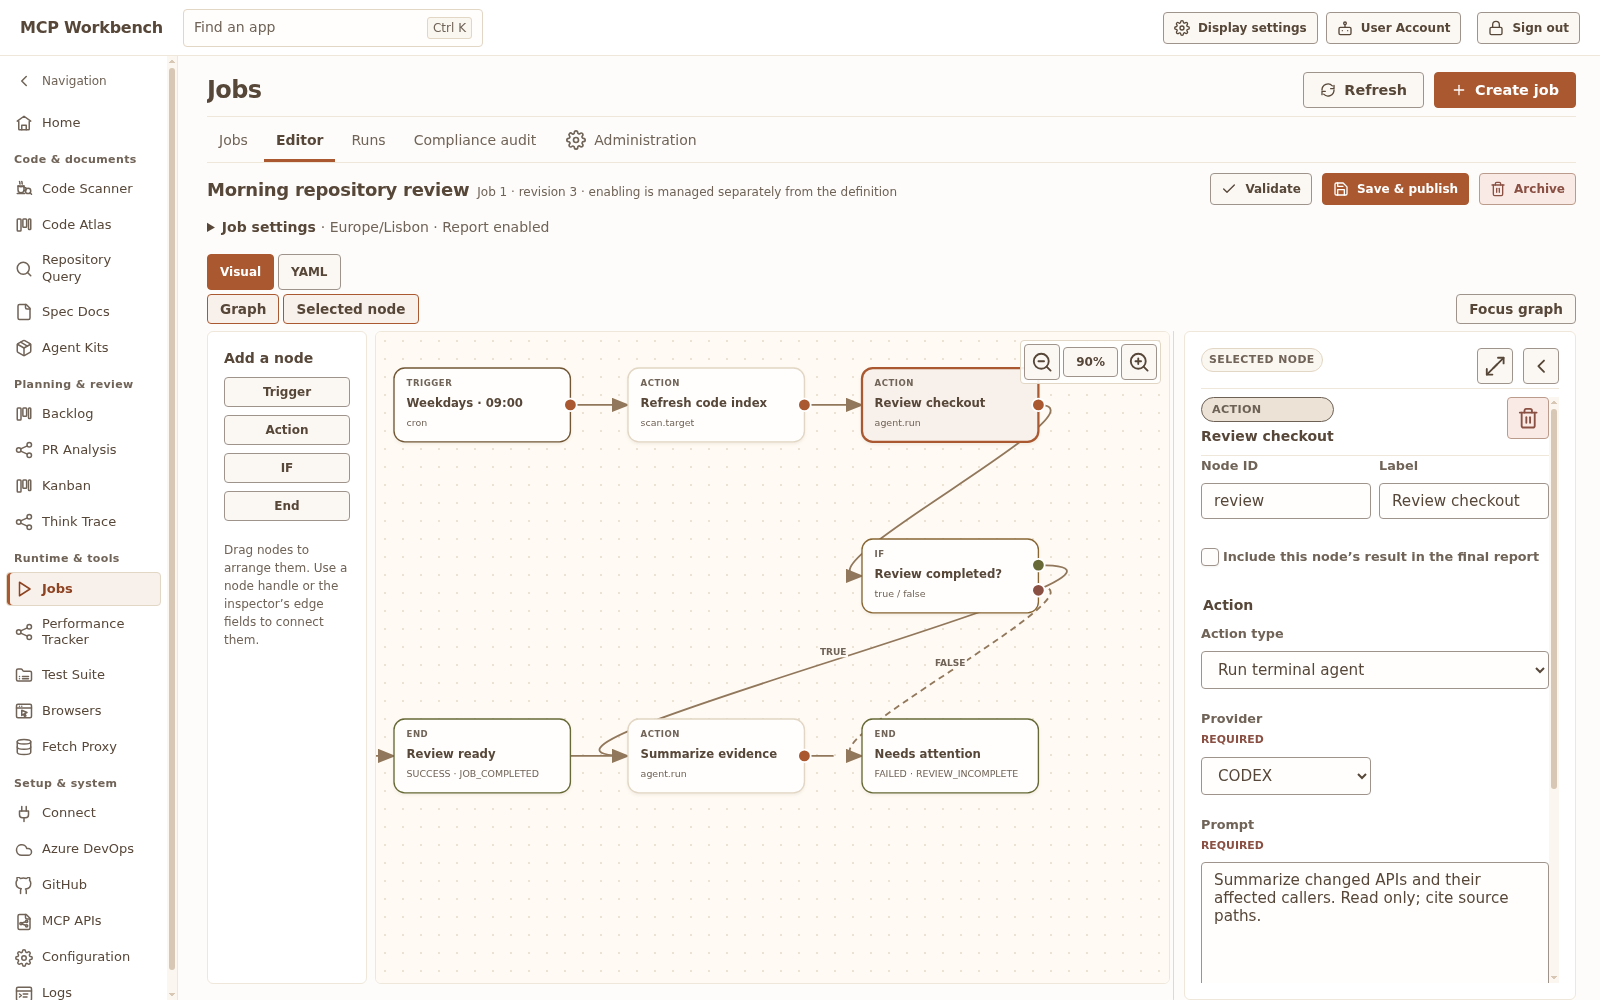
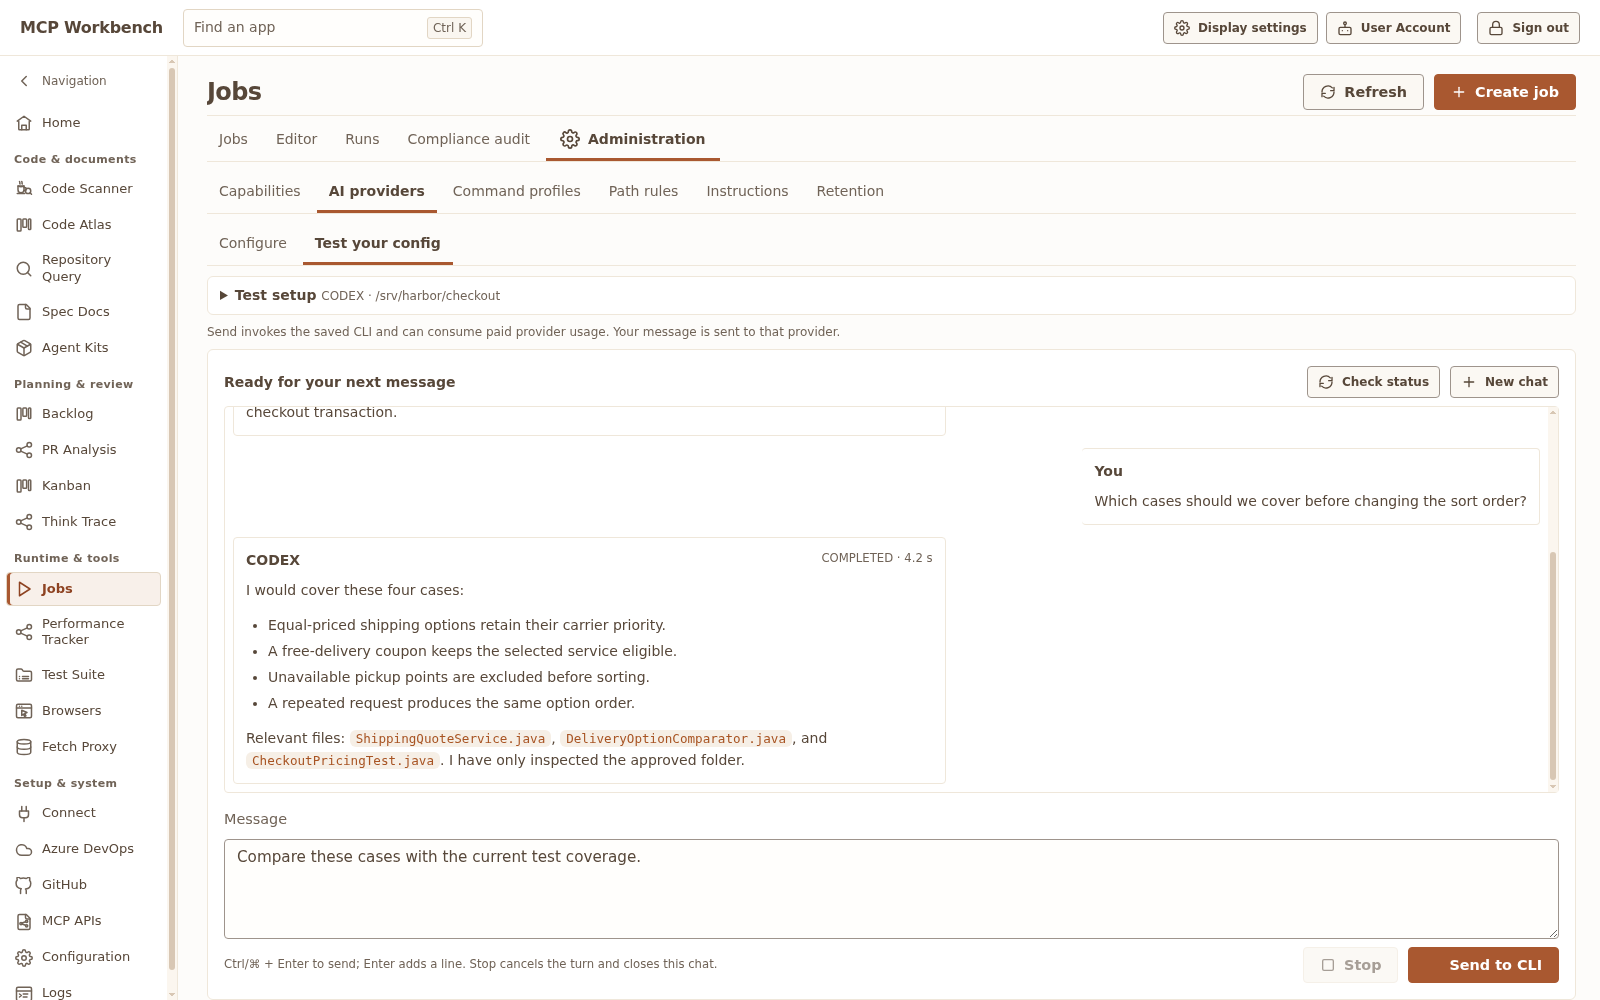
Administration defines enabled capabilities, command profiles, filesystem rules, provider models and mandatory instructions. Test your config opens an administrator-only chat against a saved Codex or Claude CLI configuration, with Send, Stop, usage information and New chat. The test is read-only and creates no workflow run.
Provider tests use the Workbench service account's provider login and can consume paid usage. They help validate configuration; they are not operating-system isolation.
Use alone or with agents
The portal stays useful even when the AI client changes.
Use Workbench directly as a local dashboard, or connect an AI client through MCP so the agent can read context, create local planning artifacts, and hand work back to you with links into the portal.
Workflow stories
Use the portal as the memory and evidence layer around AI work.
Fetch Proxy
The harness cannot fetch the evidence. Workbench can fetch it under your rules.
Send the URL through the Fetch Proxy instead of fighting the harness sandbox. Workbench validates the destination, enforces global and per-key policy, retains the response temporarily, and lets the agent search before reading bounded parts.
Harness hits a wall
Policy-approved fetch
Search, read, delete
Browser cooperation · local Workbench
The AI cannot feel the page. Open one safe browser and work in it together.
When Workbench runs on your machine, normal MCP browser tools open an isolated local profile directly. The AI can inspect semantic HTML and selectors; you can watch, click, type, and pin notes to the exact elements that need attention.
AI harnessnormal MCP browser toolsMCP Workbenchdirect process pipeIsolated local browser
checkout.cedar.test/payment
Isolated session
Payment details
All transactions are encrypted and processed in this isolated demo.
Browser cooperation · remote Workbench
Workbench is on another machine. Keep the browser beside the person anyway.
Run the small proxy/helper beside the reviewer. Workbench sends the same browser API requests over the configured authenticated HTTP/WS path; the helper turns them into local piped browser commands and returns semantic snapshots, selector-linked annotations, and bounded screenshots.
AI harnessMCPRemote Workbenchauthenticated HTTP/WSLocal proxy/helperprocess pipeIsolated local browser
Backlog + Kanban
Turn a messy request into reviewable provider changes, not a blind push.
Let the agent draft the work item, test-plan note, PR task, and board cards locally first. You can edit the proposal, keep it in a review queue, or approve the exact external write when the plan is ready.
Support request
Local proposal
Human approval
Think Trace
Turn a failed report run into a traceable repair.
When a report is slow, incomplete, or full of mystery N/A rows, point the AI at the trace id, inspect the error nodes, patch the weak skill, and rerun with a clean trail.
Broken report
Trace the errors
Patch and rerun
Quarterly margin & allocation dashboard
Trace TT-2048 · partial
Revenue$8.42M+6.8%
Gross margin12.4%1/4 regions
Allocated costN/Arequest timed out
Coverage25%3 regions missing
Revenue trend
Actual revenue+$0.54M
Cost allocation
Chart failed after deprecated endpoint retry
Margin by region
Required region parameter missing
Regional rows
North Americacomplete12.4%
South AmericamissingN/A
Europeretry timed outN/A
APACmissingN/A
Quarterly margin & allocation dashboard
Rerun complete · 2.8s
Revenue$8.42M+6.8%
Gross margin12.1%4/4 regions
Allocated cost$7.40Mcomplete
Coverage100%12 months
Revenue trend
Actual revenue+$0.54M
Regional rows
North Americacomplete12.4%
South Americacomplete10.9%
Europecomplete13.1%
APACcomplete11.8%
PR Analysis + Code Scanner + Azure DevOps
Use call hierarchy and provider history before trusting a PR review.
Old code paths do not fit in one reviewer’s head. Let the agent read the diff, trace downstream callers, and compare recent PRs before a small change becomes a long-lived bug.
Read the diff
Trace the impact
Check recent history
Downloads and installs
Choose a build, protect its data storage, and connect your first agent.
The latest stable release is v3.0.0.
Latest stable
Open the latest stable GitHub release, currently v3.0.0.
Docker
Run the published image on port 9999 and mount a data folder for persistent settings and history.
Connect an agent
Generate a scoped MCP key, then use the Connect tutorial tab for Claude Code, Codex, Copilot, Grok, or another MCP client.
Download and extract
Choose the bundled-runtime zip unless you deliberately want the smaller launcher-only build and already manage a compatible Java runtime.
Start the launcher
Run the Windows or macOS launcher from the extracted folder. It starts Workbench with a dedicated data directory and attributes launcher requests as windows-launcher or mac-launcher in the audit trail.
macOS: allow the unsigned app
If macOS blocks the first launch, open System Settings → Privacy & Security, find the blocked MCP Workbench message, choose Open Anyway, then confirm. Only do this for the release you intended to download.
Windows: review the warning
If SmartScreen appears, verify the download came from the release repository, inspect the published SHA-256 file if needed, then choose the option to run it. Corporate policy may require an administrator.
Create an account key
Sign in, open User Account, create one named MCP key per agent, and narrow its tool groups before copying the secret. The secret is shown once.
Connect and test
Open Connect, select your AI harness tab, follow the four steps, and ask the agent to list available tools before granting provider credentials or write scopes.
Privacy
Built for local-first control.
Workbench runs as your local or self-hosted portal. Your chosen H2 or PostgreSQL database, credentials, MCP keys, traces, cards, and scan history stay under your control unless you explicitly connect external services or approve an action that writes to them.
Licensing
Free for research and learning, not a corporate free-for-all.
The code is source-available. Personal learning, student work, teaching, and nonprofit research are allowed. Enterprise, commercial, production, client, customer, or revenue-generating use requires written permission.

Important notes